Kymera Investor Presentation Deck
Relative Quantification
(% Vehicle, p53/ACTB)
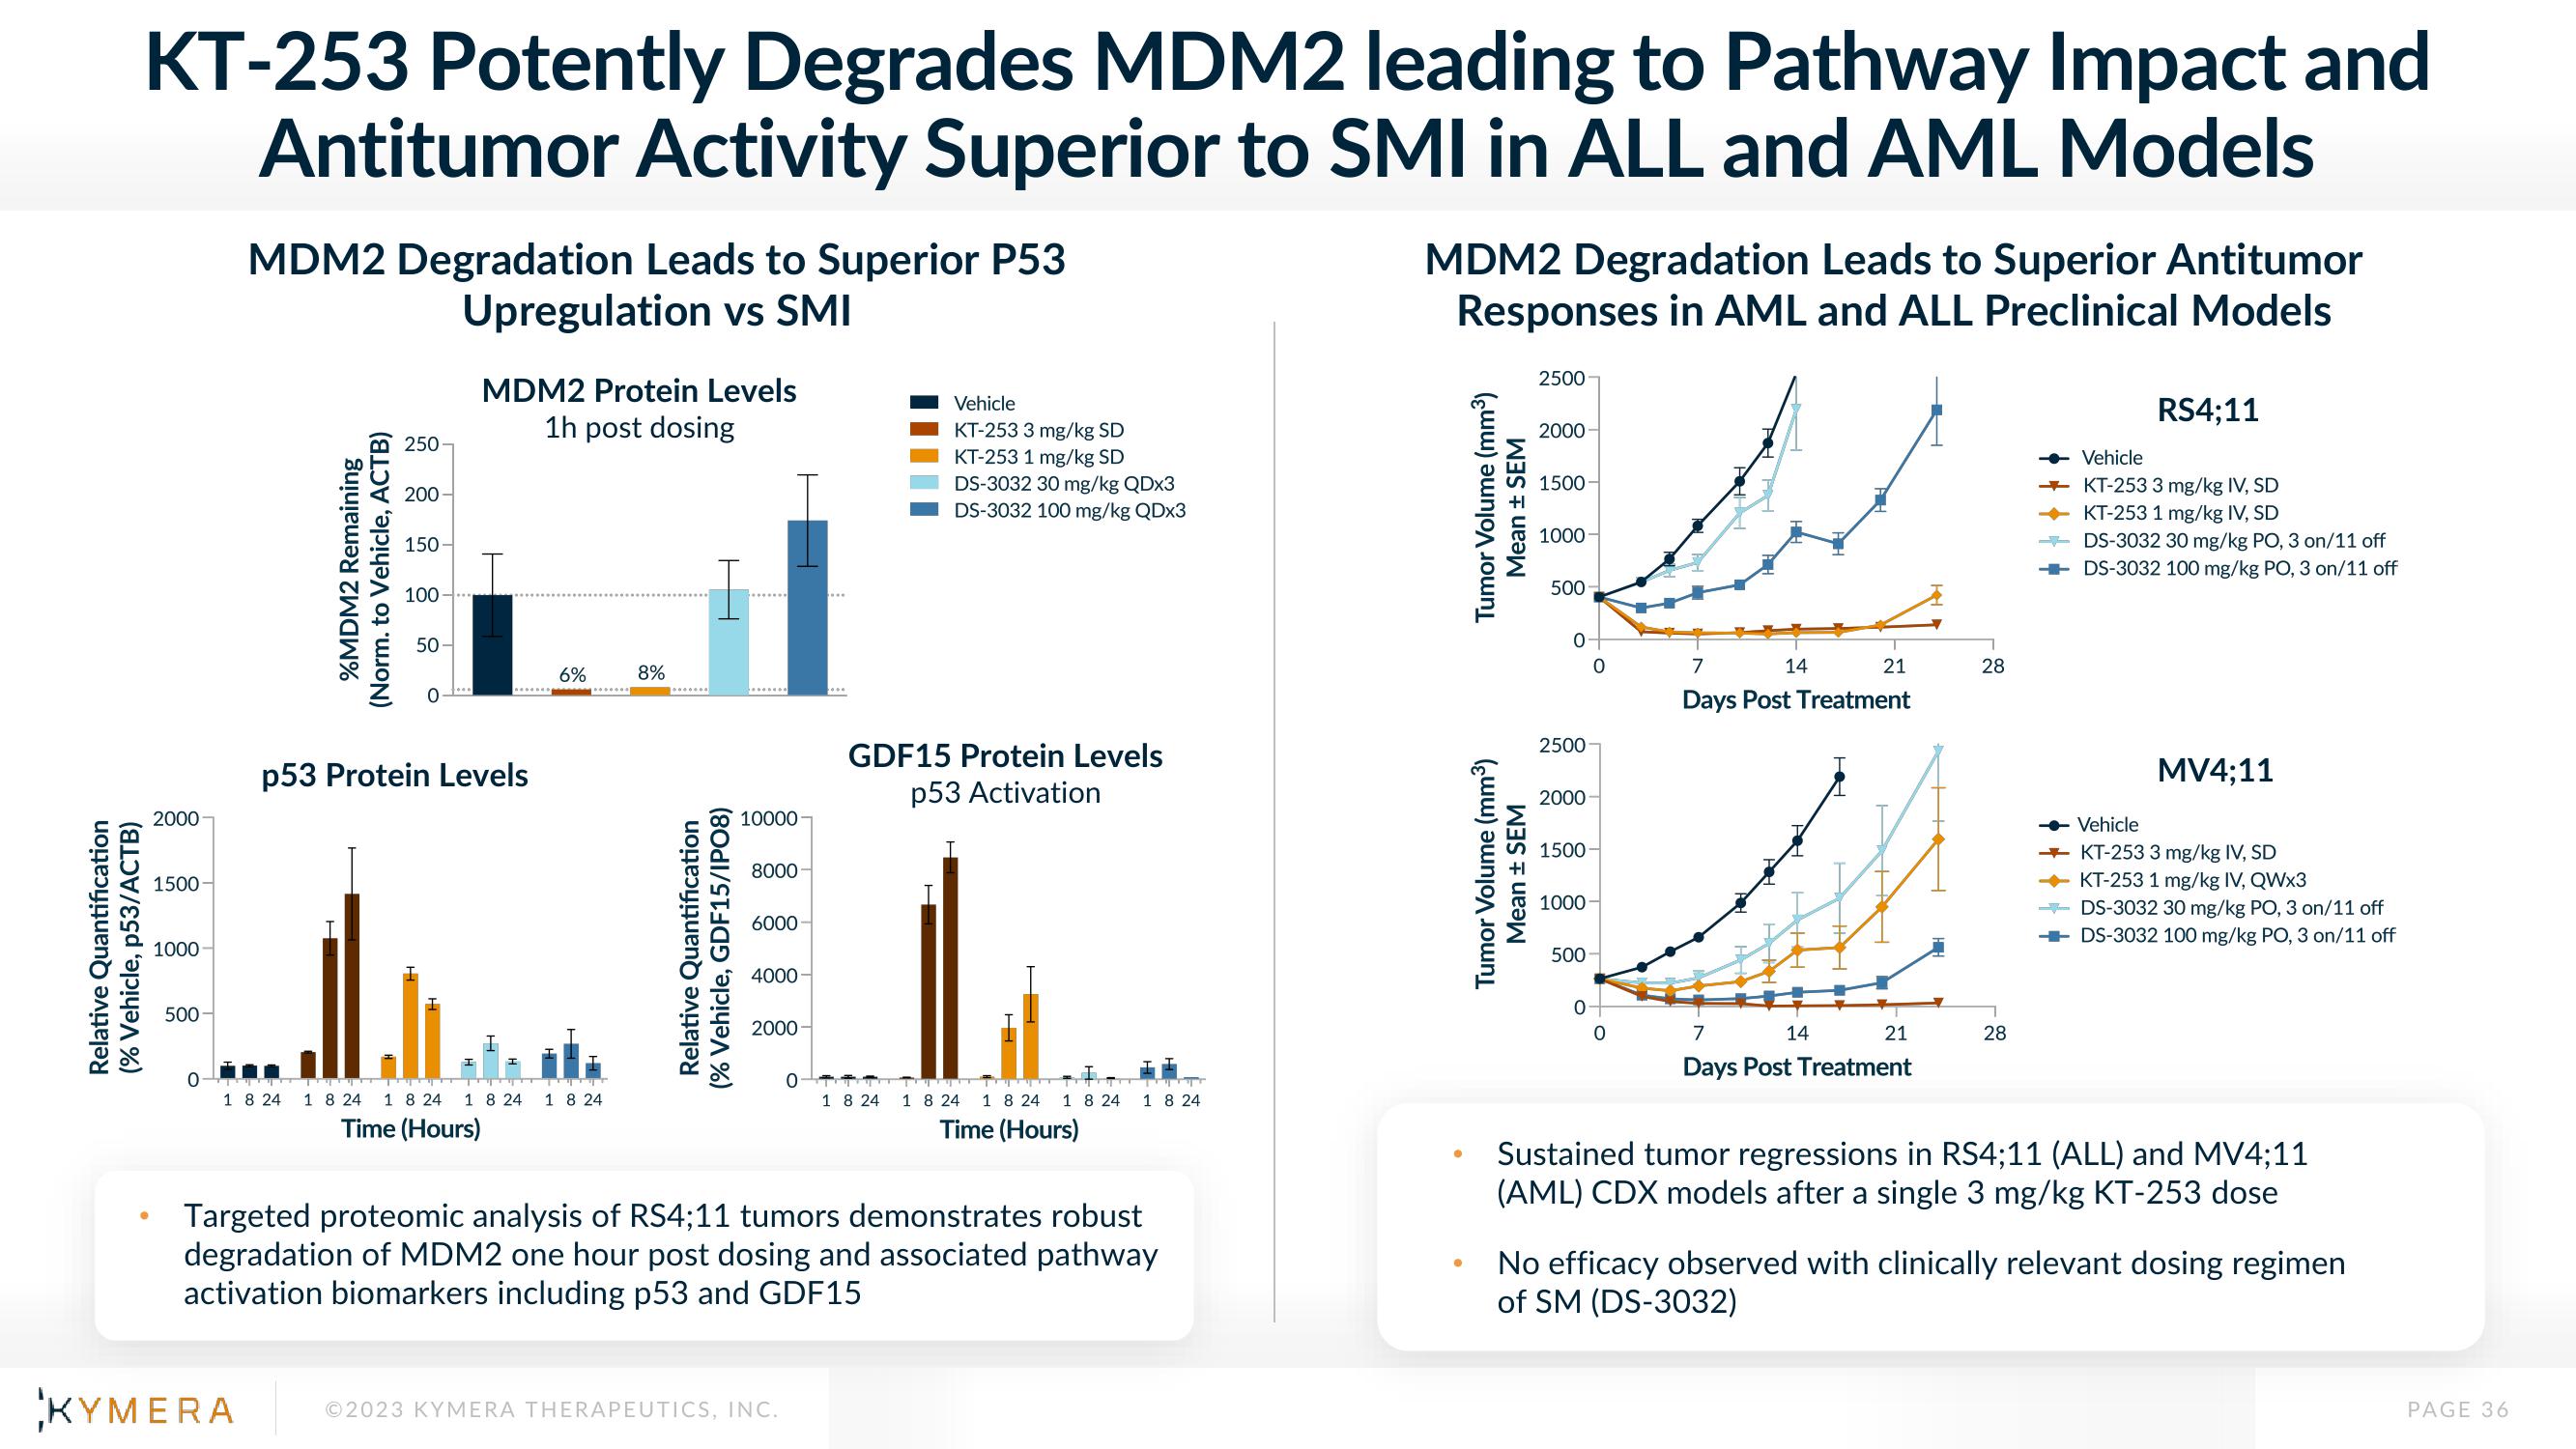
KT-253 Potently Degrades MDM2 leading to Pathway Impact and
Antitumor Activity Superior to SMI in ALL and AML Models
e
2000
1500-
1000
500
0
MDM2 Degradation Leads to Superior P53
Upregulation vs SMI
%MDM2 Remaining
(Norm. to Vehicle, ACTB)
18 24
250-
200-
150-
100-
50-
MDM2 Protein Levels
1h post dosing
p53 Protein Levels
6%
1 8 24 1 8 24 1 8 24 1 8 24
Time (Hours)
8%
Relative Quantification
(% Vehicle, GDF15/IPO8)
10000
8000
6000
4000
2000
0
KYMERA ©2023 KYMERA THERAPEUTICS, INC.
Vehicle
KT-253 3 mg/kg SD
KT-253 1 mg/kg SD
DS-3032 30 mg/kg QDx3
DS-3032 100 mg/kg QDx3
GDF15 Protein Levels
p53 Activation
1 8 24
1 8 24 18 24 1 8 24
Time (Hours)
1 8 24
Targeted proteomic analysis of RS4;11 tumors demonstrates robust
degradation of MDM2 one hour post dosing and associated pathway
activation biomarkers including p53 and GDF15
MDM2 Degradation Leads to Superior Antitumor
Responses in AML and ALL Preclinical Models
Tumor Volume (mm³)
Mean ± SEM
Tumor Volume (mm³)
Mean ± SEM
2500
2000
1500
1000-
500
O
2500
2000
1500
0
1000-
500-
0
0
7
14
Days Post Treatment
21
7
14
Days Post Treatment
21
28
28
RS4;11
Vehicle
KT-253 3 mg/kg IV, SD
KT-253 1 mg/kg IV, SD
DS-3032 30 mg/kg PO, 3 on/11 off
DS-3032 100 mg/kg PO, 3 on/11 off
MV4;11
Vehicle
KT-253 3 mg/kg IV, SD
KT-253 1 mg/kg IV, QWx3
-DS-3032 30 mg/kg PO, 3 on/11 off
DS-3032 100 mg/kg PO, 3 on/11 off
Sustained tumor regressions in RS4;11 (ALL) and MV4;11
(AML) CDX models after a single 3 mg/kg KT-253 dose
No efficacy observed with clinically relevant dosing regimen
of SM (DS-3032)
PAGE 36View entire presentation