Informatica Investor Presentation Deck
44
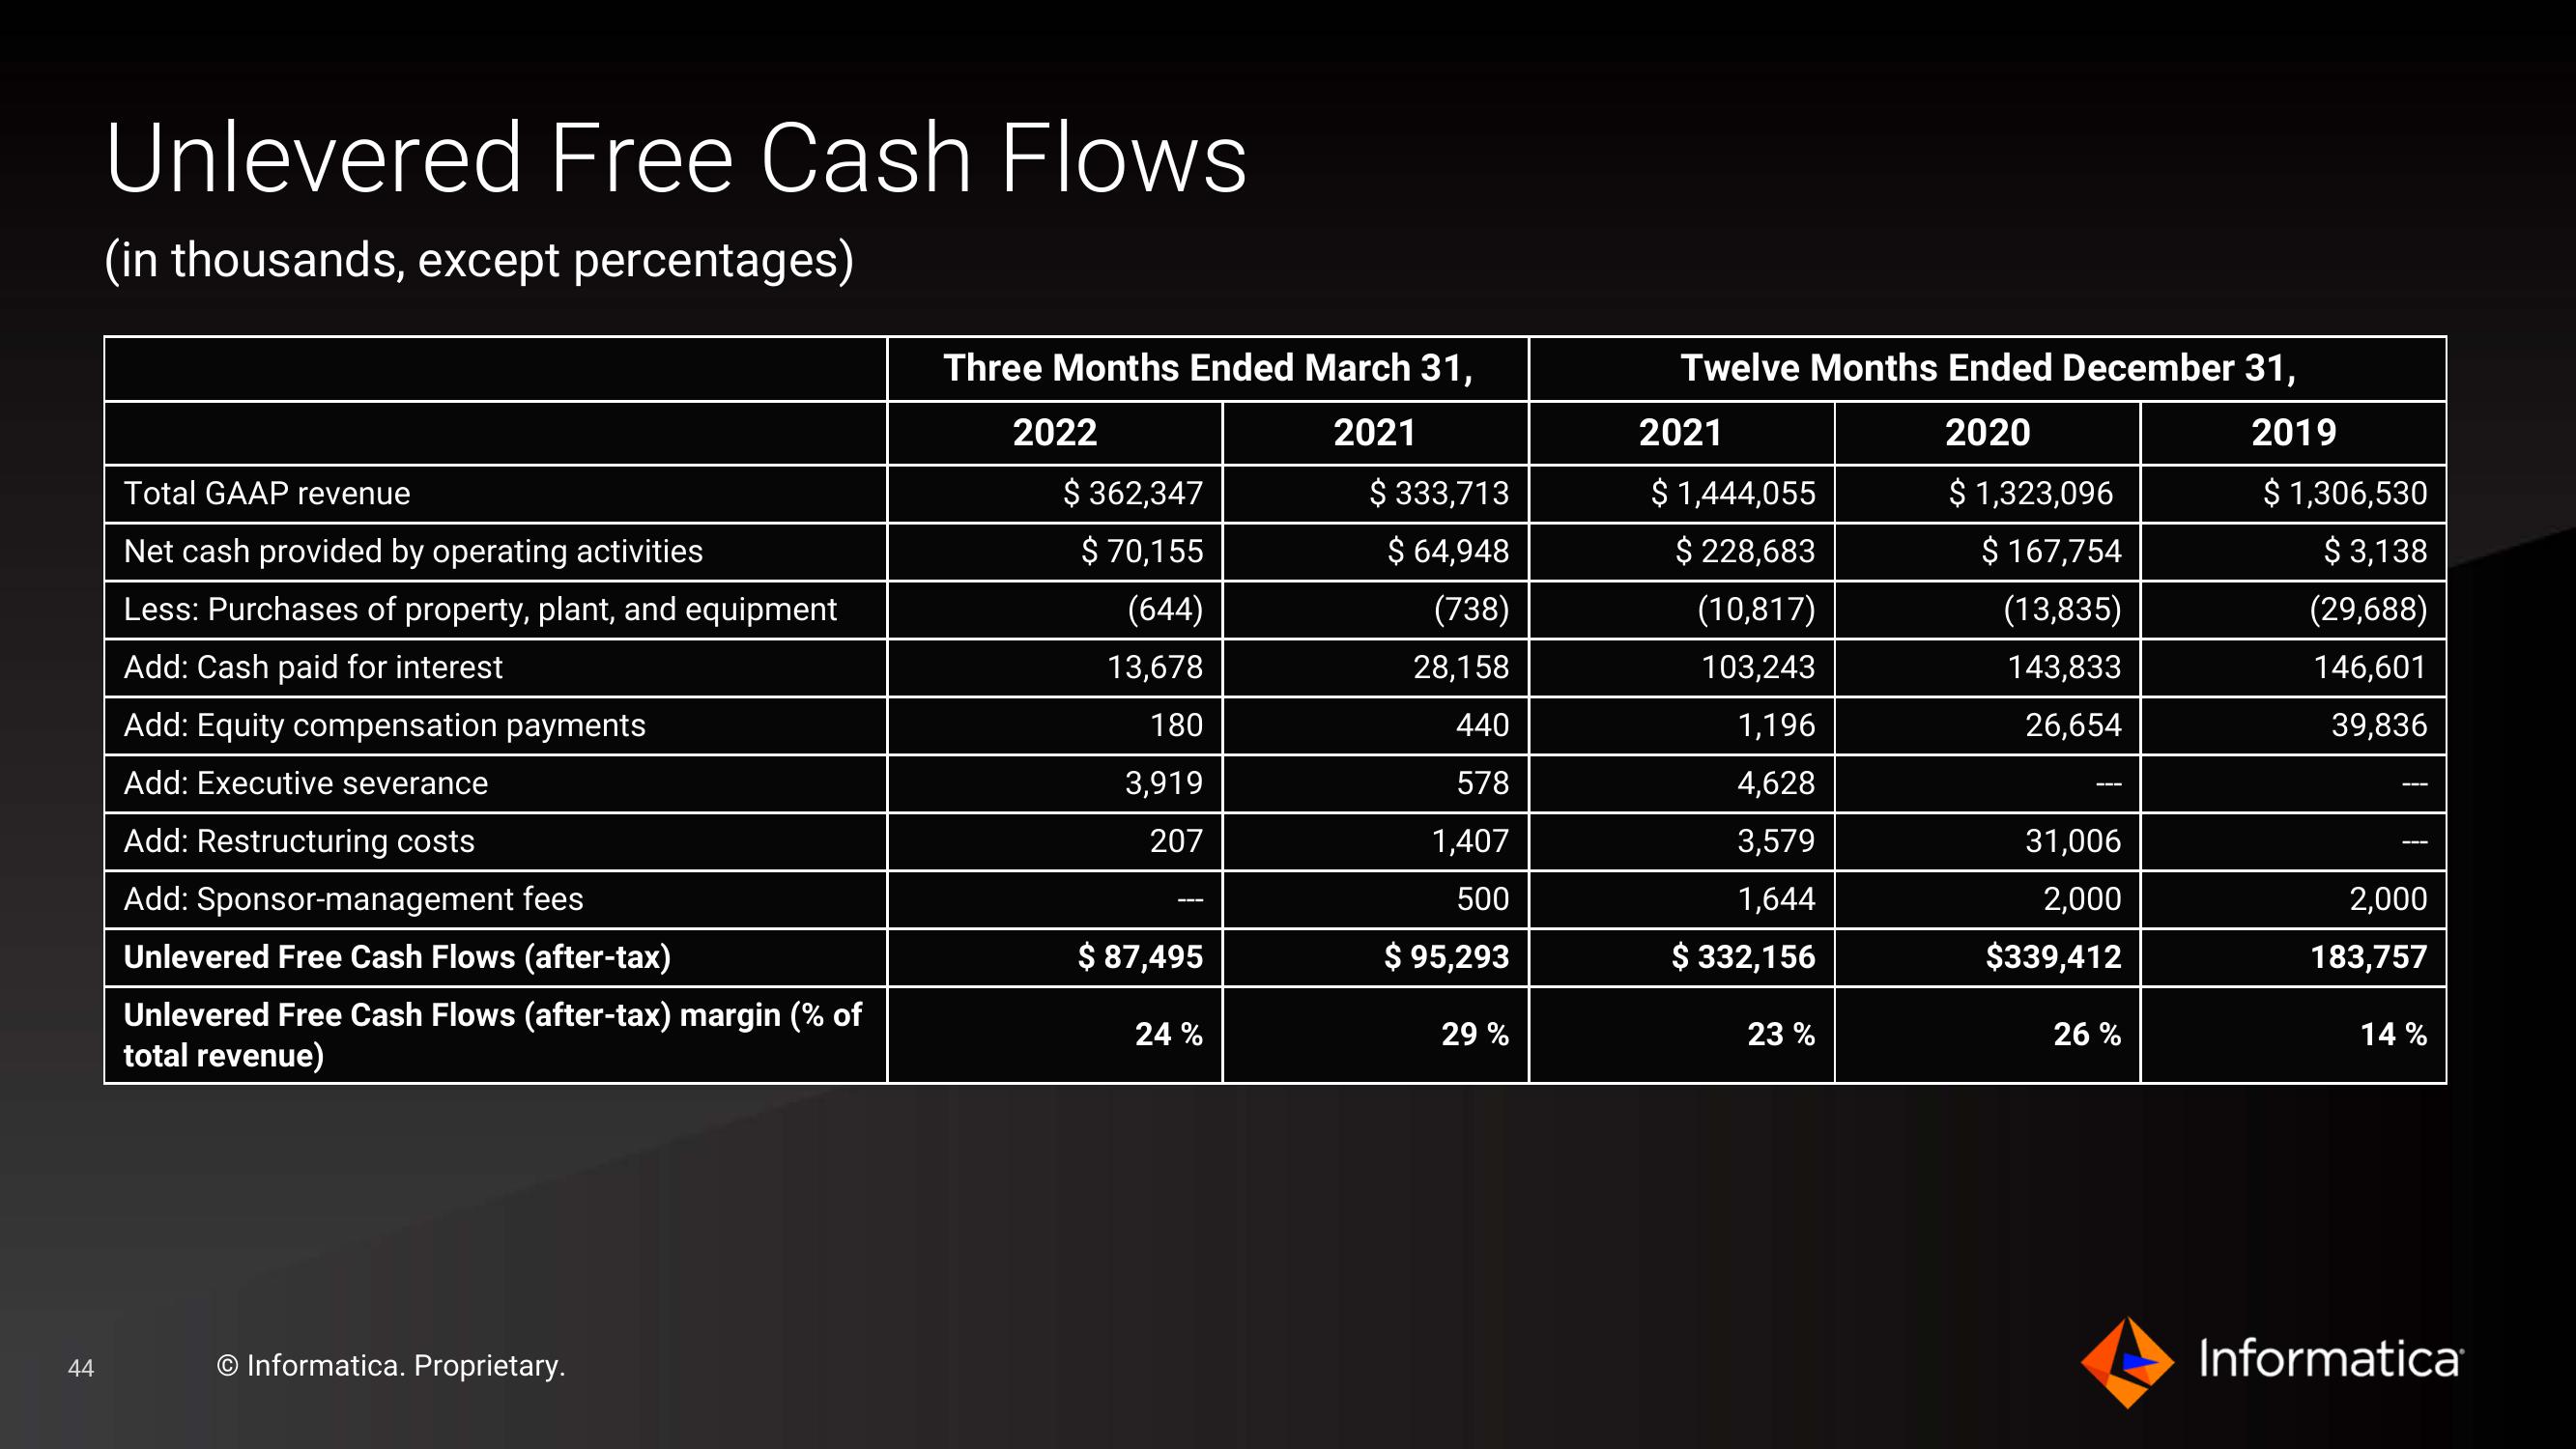
Unlevered Free Cash Flows
(in thousands, except percentages)
Total GAAP revenue
Net cash provided by operating activities
Less: Purchases of property, plant, and equipment
Add: Cash paid for interest
Add: Equity compensation payments
Add: Executive severance
Add: Restructuring costs
Add: Sponsor-management fees
Unlevered Free Cash Flows (after-tax)
Unlevered Free Cash Flows (after-tax) margin (% of
total revenue)
Informatica. Proprietary.
Three Months Ended March 31,
2021
$ 333,713
$ 64,948
(738)
28,158
440
578
1,407
500
$ 95,293
2022
$362,347
$ 70,155
(644)
13,678
180
3,919
207
===
$ 87,495
24 %
29%
Twelve Months Ended December 31,
2020
2019
$ 1,306,530
$ 3,138
(29,688)
146,601
39,836
2021
$ 1,444,055
$ 228,683
(10,817)
103,243
1,196
4,628
3,579
1,644
$ 332,156
23 %
$ 1,323,096
$ 167,754
(13,835)
143,833
26,654
31,006
2,000
$339,412
26%
2,000
183,757
14%
InformaticaView entire presentation