Investor Presentation
Review of Q3 FY'21 Results
(in million)
Reported
3Q FY'20
Adjusted
Reported
INR
3Q FY'20
INR
3Q FY'21
INR
Reported
3Q FY'21
US$
3Q FY'21 After
Adjustments*
US$
Adjustments
US$
Revenue
3,047
3,047
3,521
48.2
Cost of Operations
267
267
306
4.2
% Change
adjusted Q3 FY'21
vs adjusted Q3
FY'20
Comments
48.2
16%
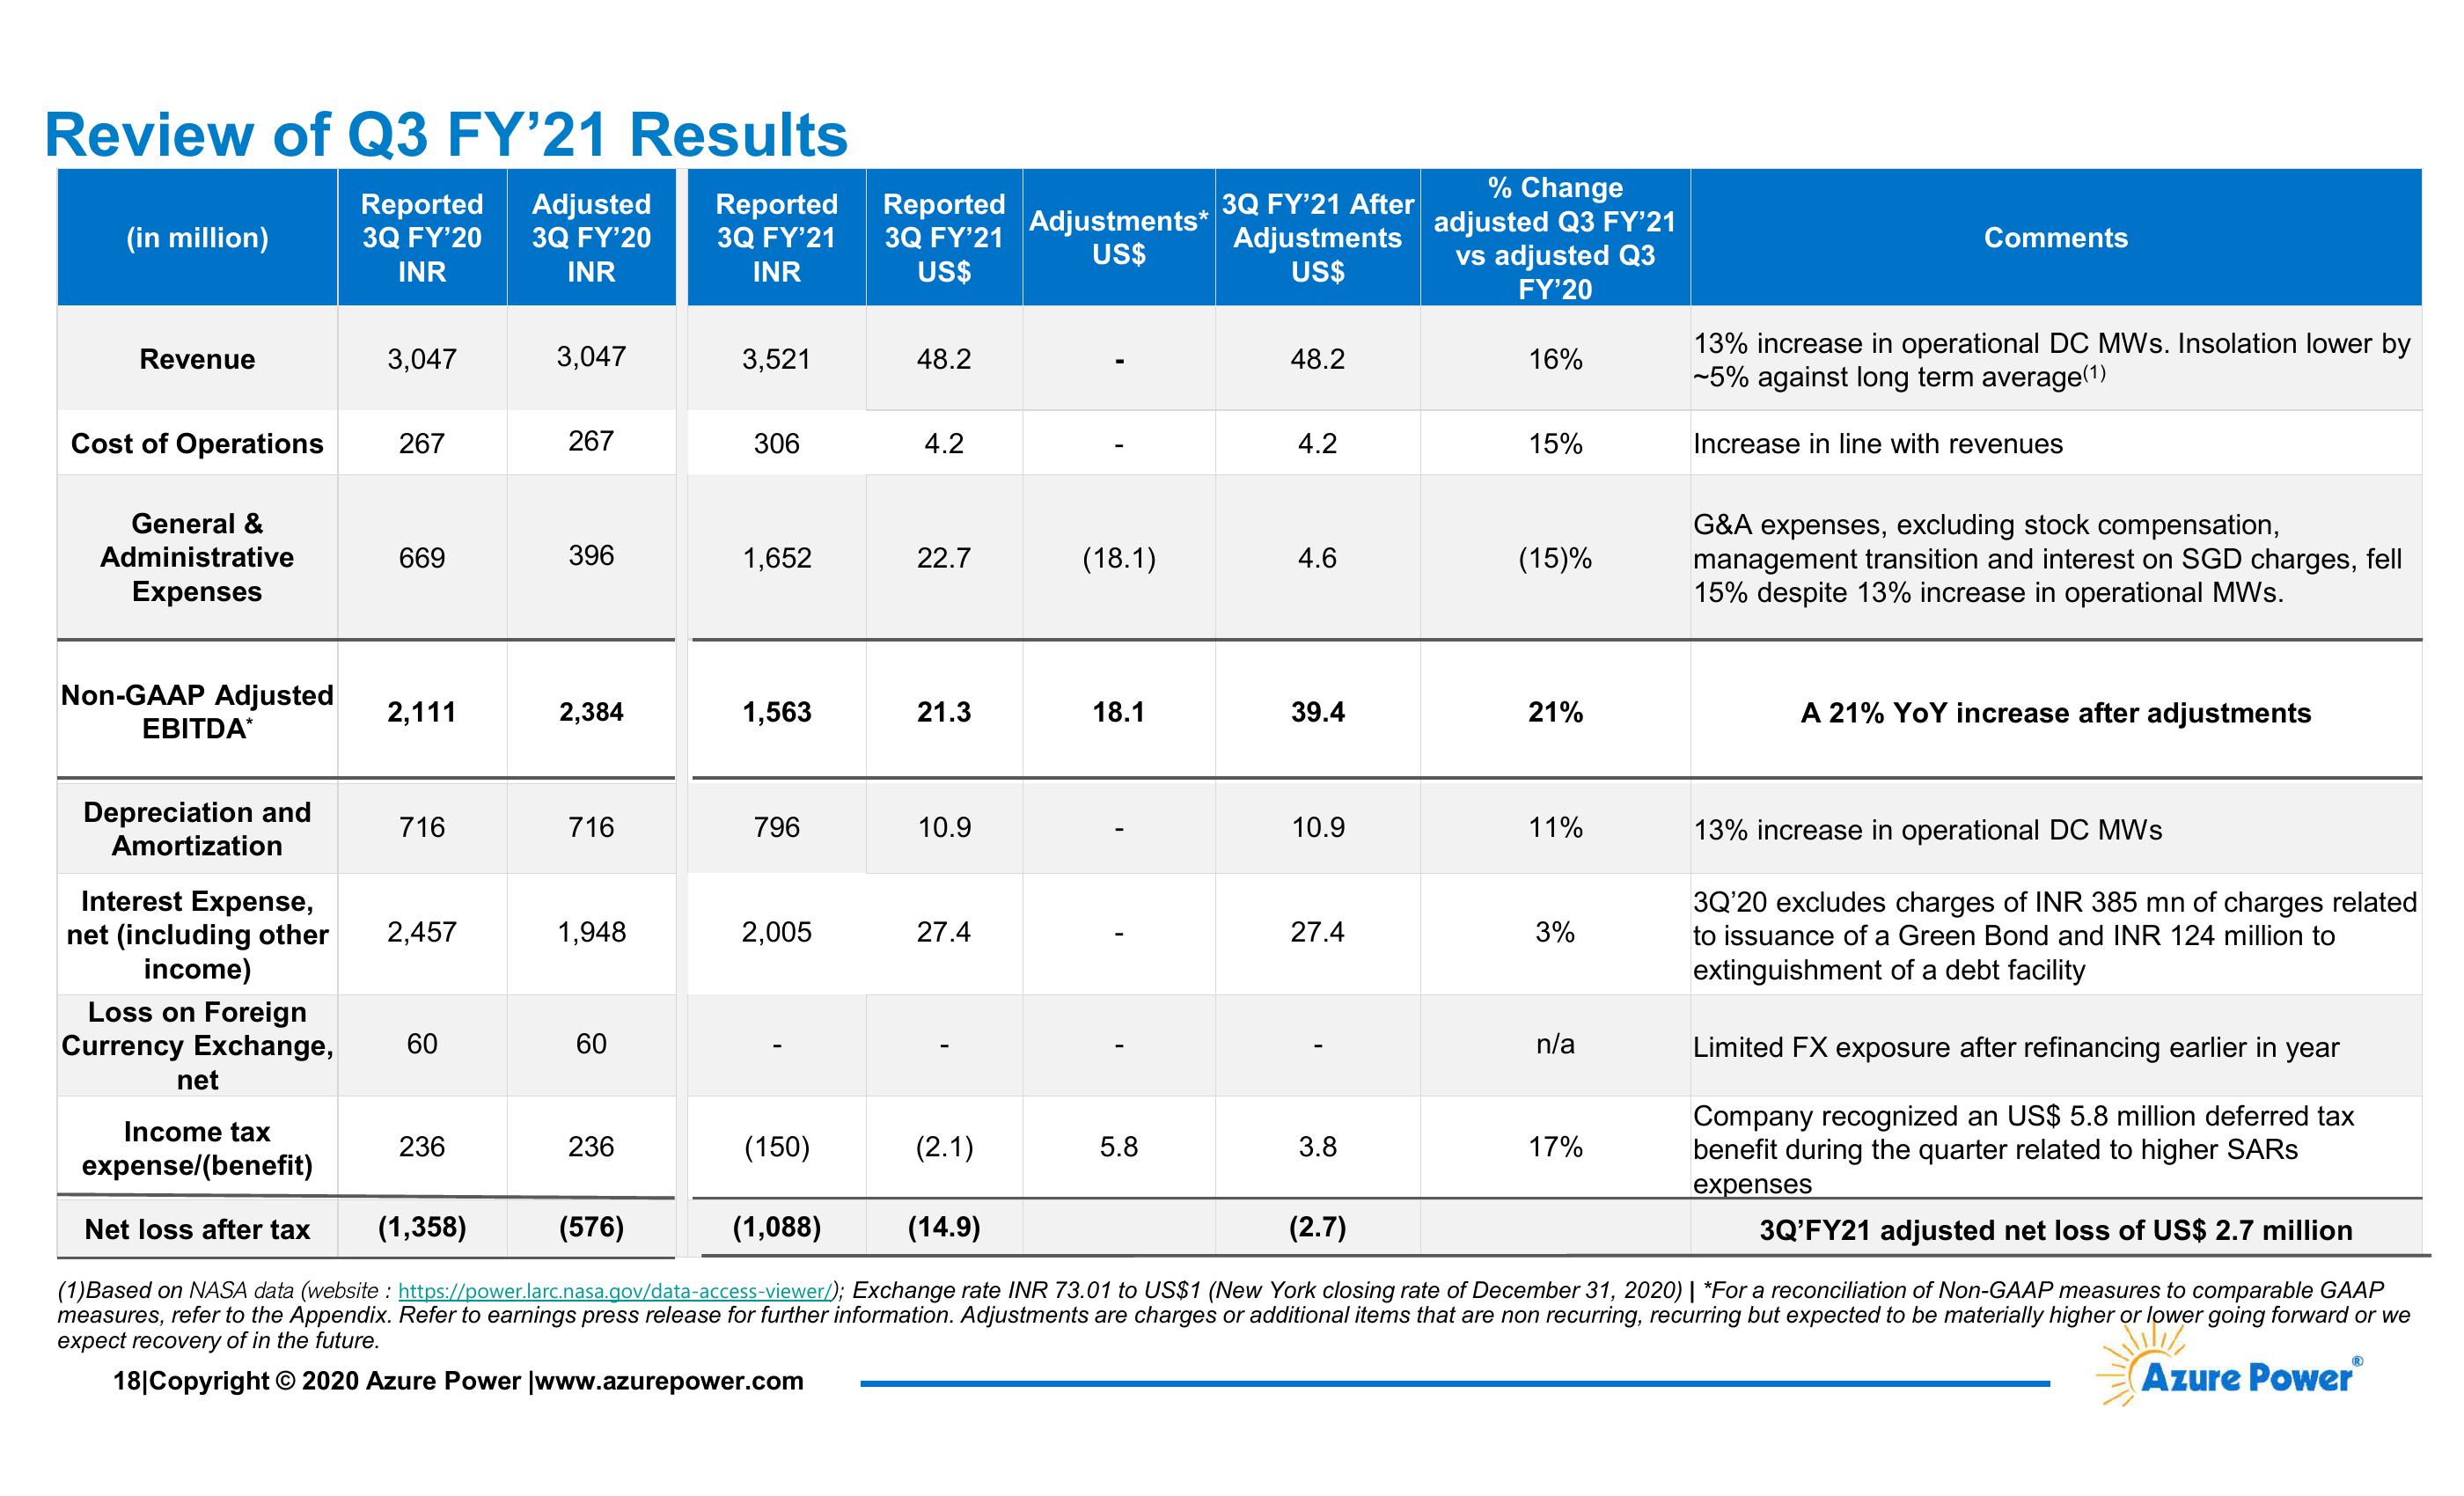
13% increase in operational DC MWs. Insolation lower by
~5% against long term average(1)
4.2
15%
Increase in line with revenues
General &
Administrative
669
396
1,652
22.7
(18.1)
4.6
(15)%
Expenses
G&A expenses, excluding stock compensation,
management transition and interest on SGD charges, fell
15% despite 13% increase in operational MWs.
Non-GAAP Adjusted
2,111
2,384
1,563
21.3
18.1
39.4
21%
A 21% YoY increase after adjustments
EBITDA*
Depreciation and
716
716
796
10.9
10.9
11%
Amortization
Interest Expense,
net (including other
2,457
1,948
2,005
27.4
27.4
3%
income)
13% increase in operational DC MWS
3Q'20 excludes charges of INR 385 mn of charges related
to issuance of a Green Bond and INR 124 million to
extinguishment of a debt facility
Loss on Foreign
Currency Exchange,
60
60
n/a
Limited FX exposure after refinancing earlier in year
net
Income tax
expense/(benefit)
236
236
(150)
(2.1)
5.8
3.8
17%
Company recognized an US$ 5.8 million deferred tax
benefit during the quarter related to higher SARS
expenses
Net loss after tax
(1,358)
(576)
(1,088)
(14.9)
(2.7)
3Q'FY21 adjusted net loss of US$ 2.7 million
(1) Based on NASA data (website: https://power.larc.nasa.gov/data-access-viewer/); Exchange rate INR 73.01 to US$1 (New York closing rate of December 31, 2020) | *For a reconciliation of Non-GAAP measures to comparable GAAP
measures, refer to the Appendix. Refer to earnings press release for further information. Adjustments are charges or additional items that are non recurring, recurring but expected to be materially higher or lower going forward or we
expect recovery of in the future.
18|Copyright © 2020 Azure Power |www.azurepower.com
Azure PowerⓇView entire presentation