Ford Results 3Q23 Earnings
Ford
Credit
A strategic asset and competitive
advantage
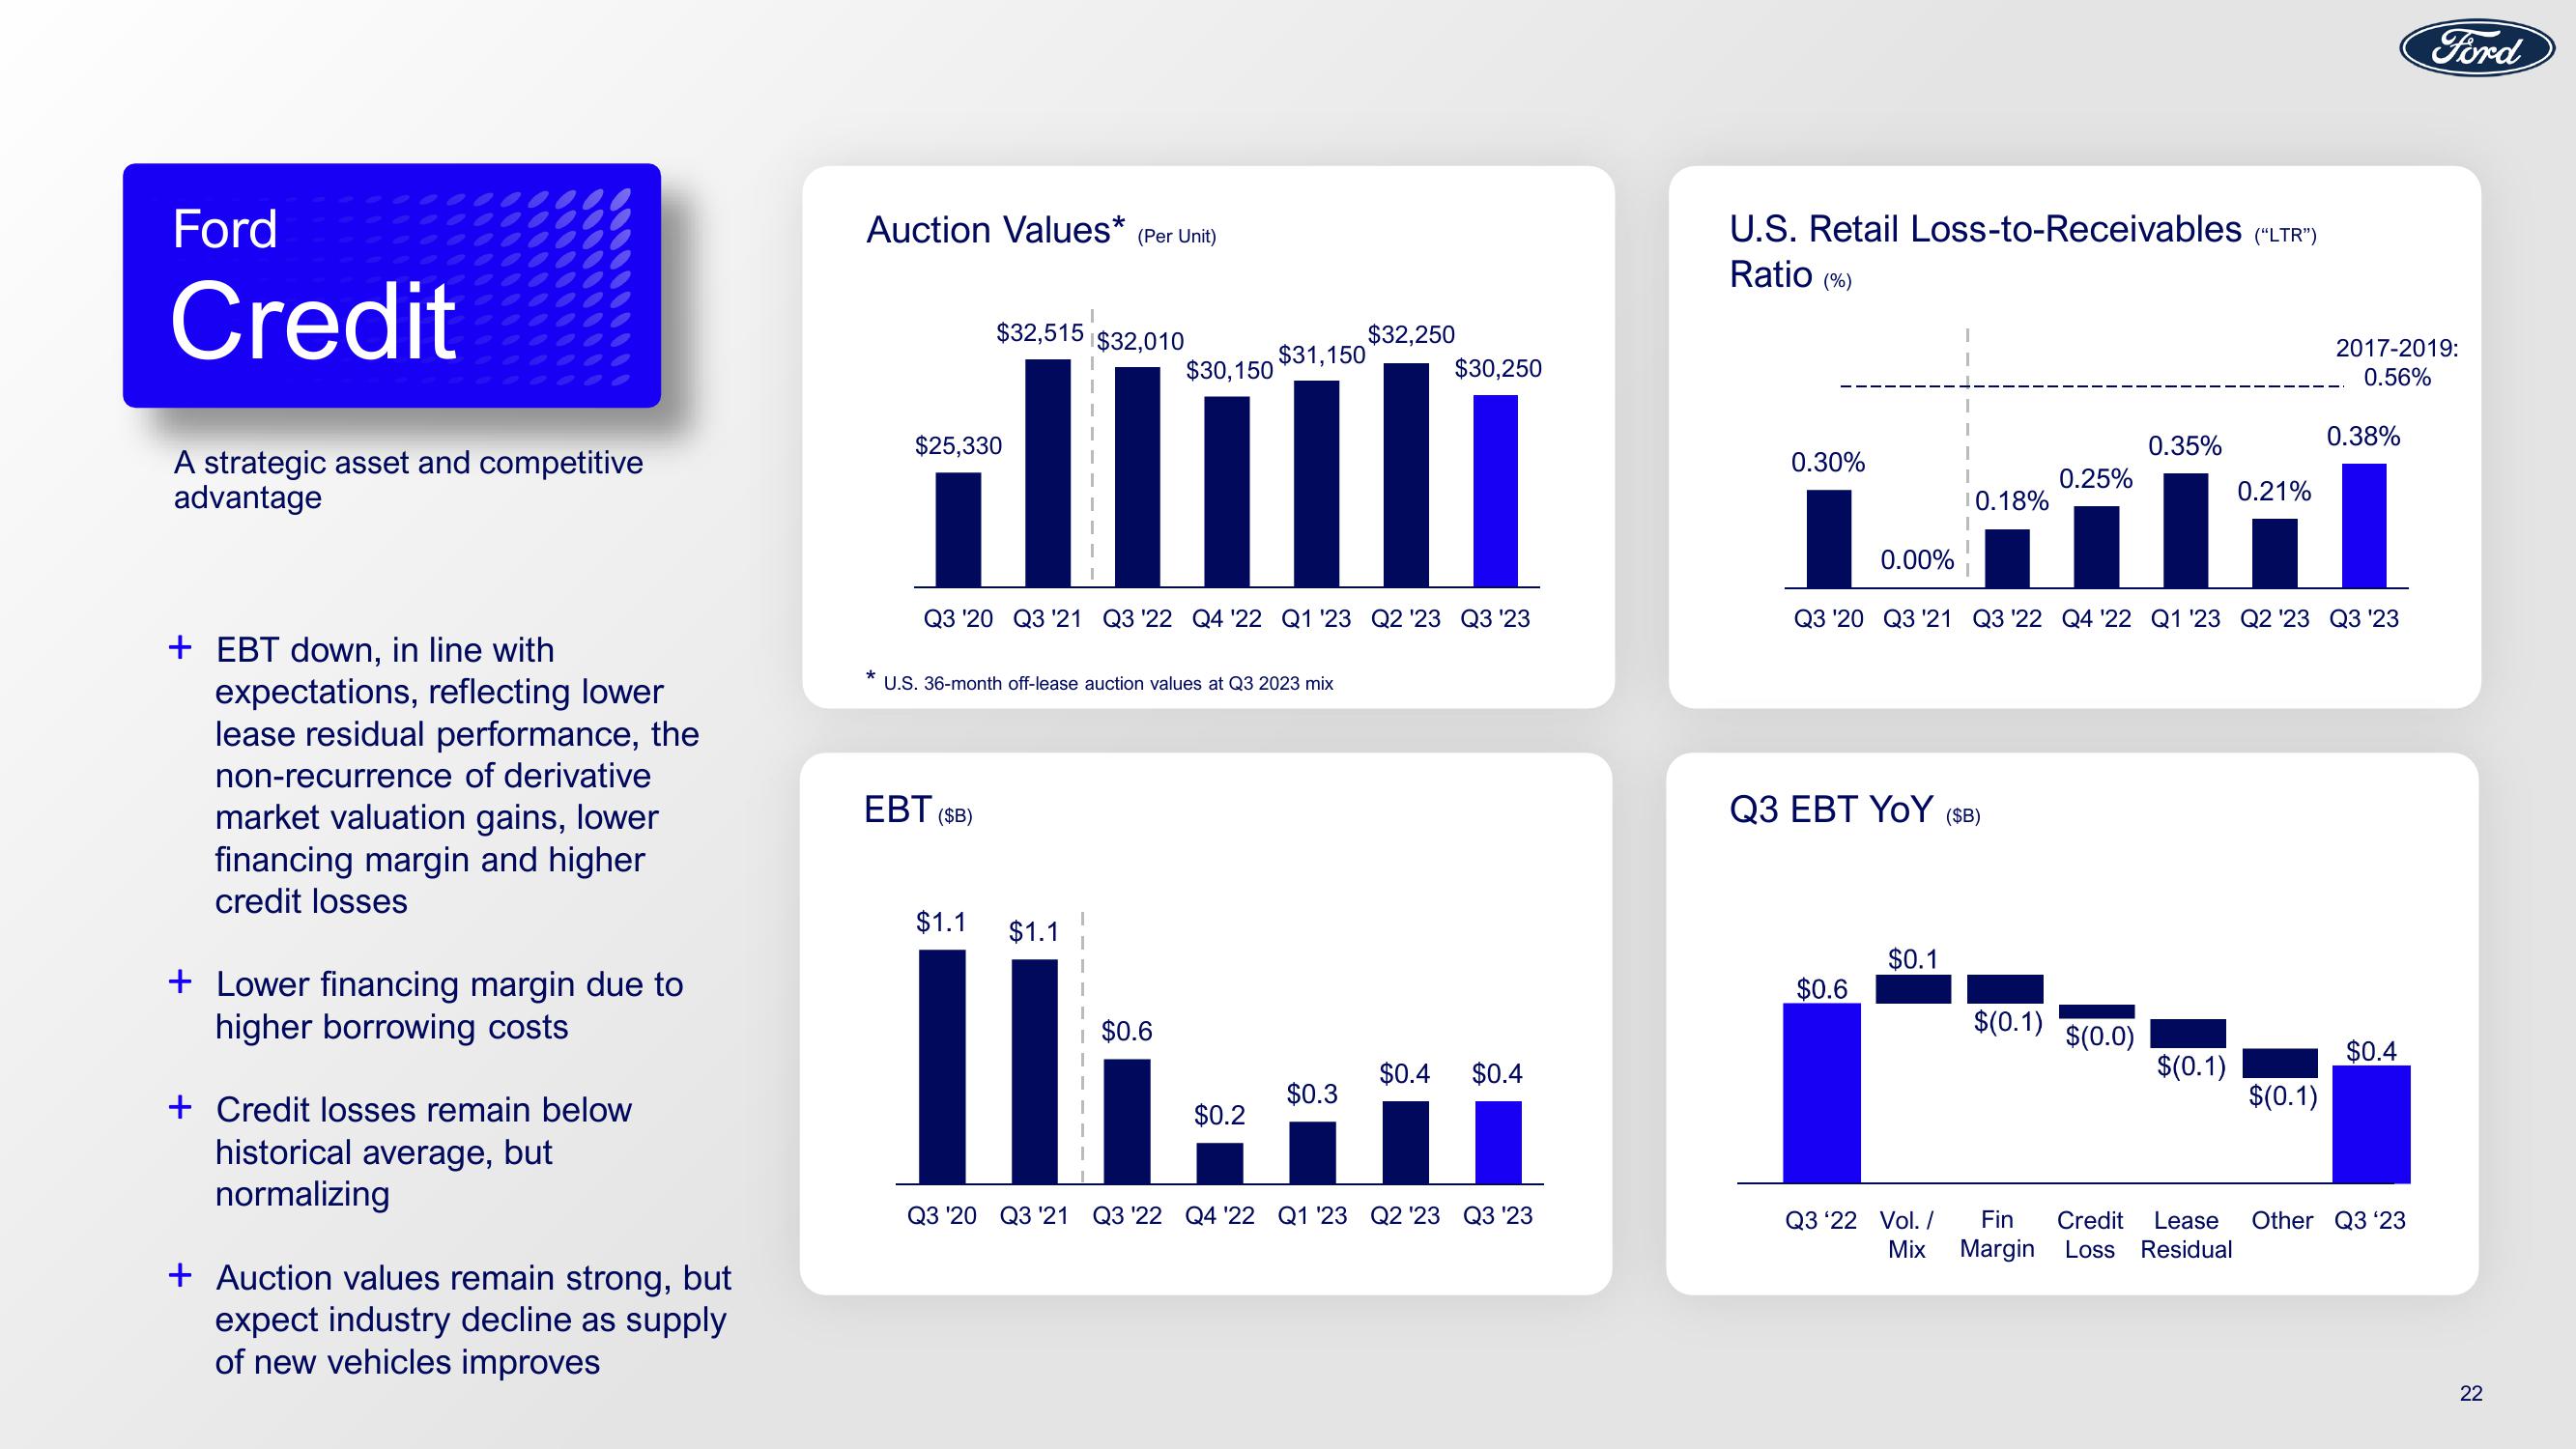
+ EBT down, in line with
expectations, reflecting lower
lease residual performance, the
non-recurrence of derivative
market valuation gains, lower
financing margin and higher
credit losses
+ Lower financing margin due to
higher borrowing costs
+ Credit losses remain below
historical average, but
normalizing
+ Auction values remain strong, but
expect industry decline as supply
of new vehicles improves
Auction Values* (Per Unit)
$32,515 $32,010
11
$25,330
EBT ($B)
$30,150
* U.S. 36-month off-lease auction values at Q3 2023 mix
$1.1 $1.1
11
Q3 '20 Q3 '21 Q3 '22 Q4 '22 Q1 '23 Q2 '23 Q3 '23
$0.6
$31,150
$0.2
$32,250
$0.3
$30,250
$0.4
$0.4
Q3 '20 Q3 '21 Q3 '22 Q4 '22 Q1 '23 Q2 '23 Q3 '23
U.S. Retail Loss-to-Receivables ("LTR")
Ratio (%)
0.30%
0.00%
$0.6
Q3 EBT YOY ($B)
10.18%
$0.1
Q3 '22 Vol. /
Mix
0.25%
Q3 '20 Q3 '21 Q3 '22 Q4 '22 Q1 '23 Q2 '23 Q3 '23
$(0.1)
0.35%
$(0.0)
0.21%
$(0.1)
$(0.1)
2017-2019:
0.56%
0.38%
$0.4
Ford
Fin Credit Lease Other Q3 '23
Margin Loss Residual
22View entire presentation