Ashtead Group Results Presentation Deck
11
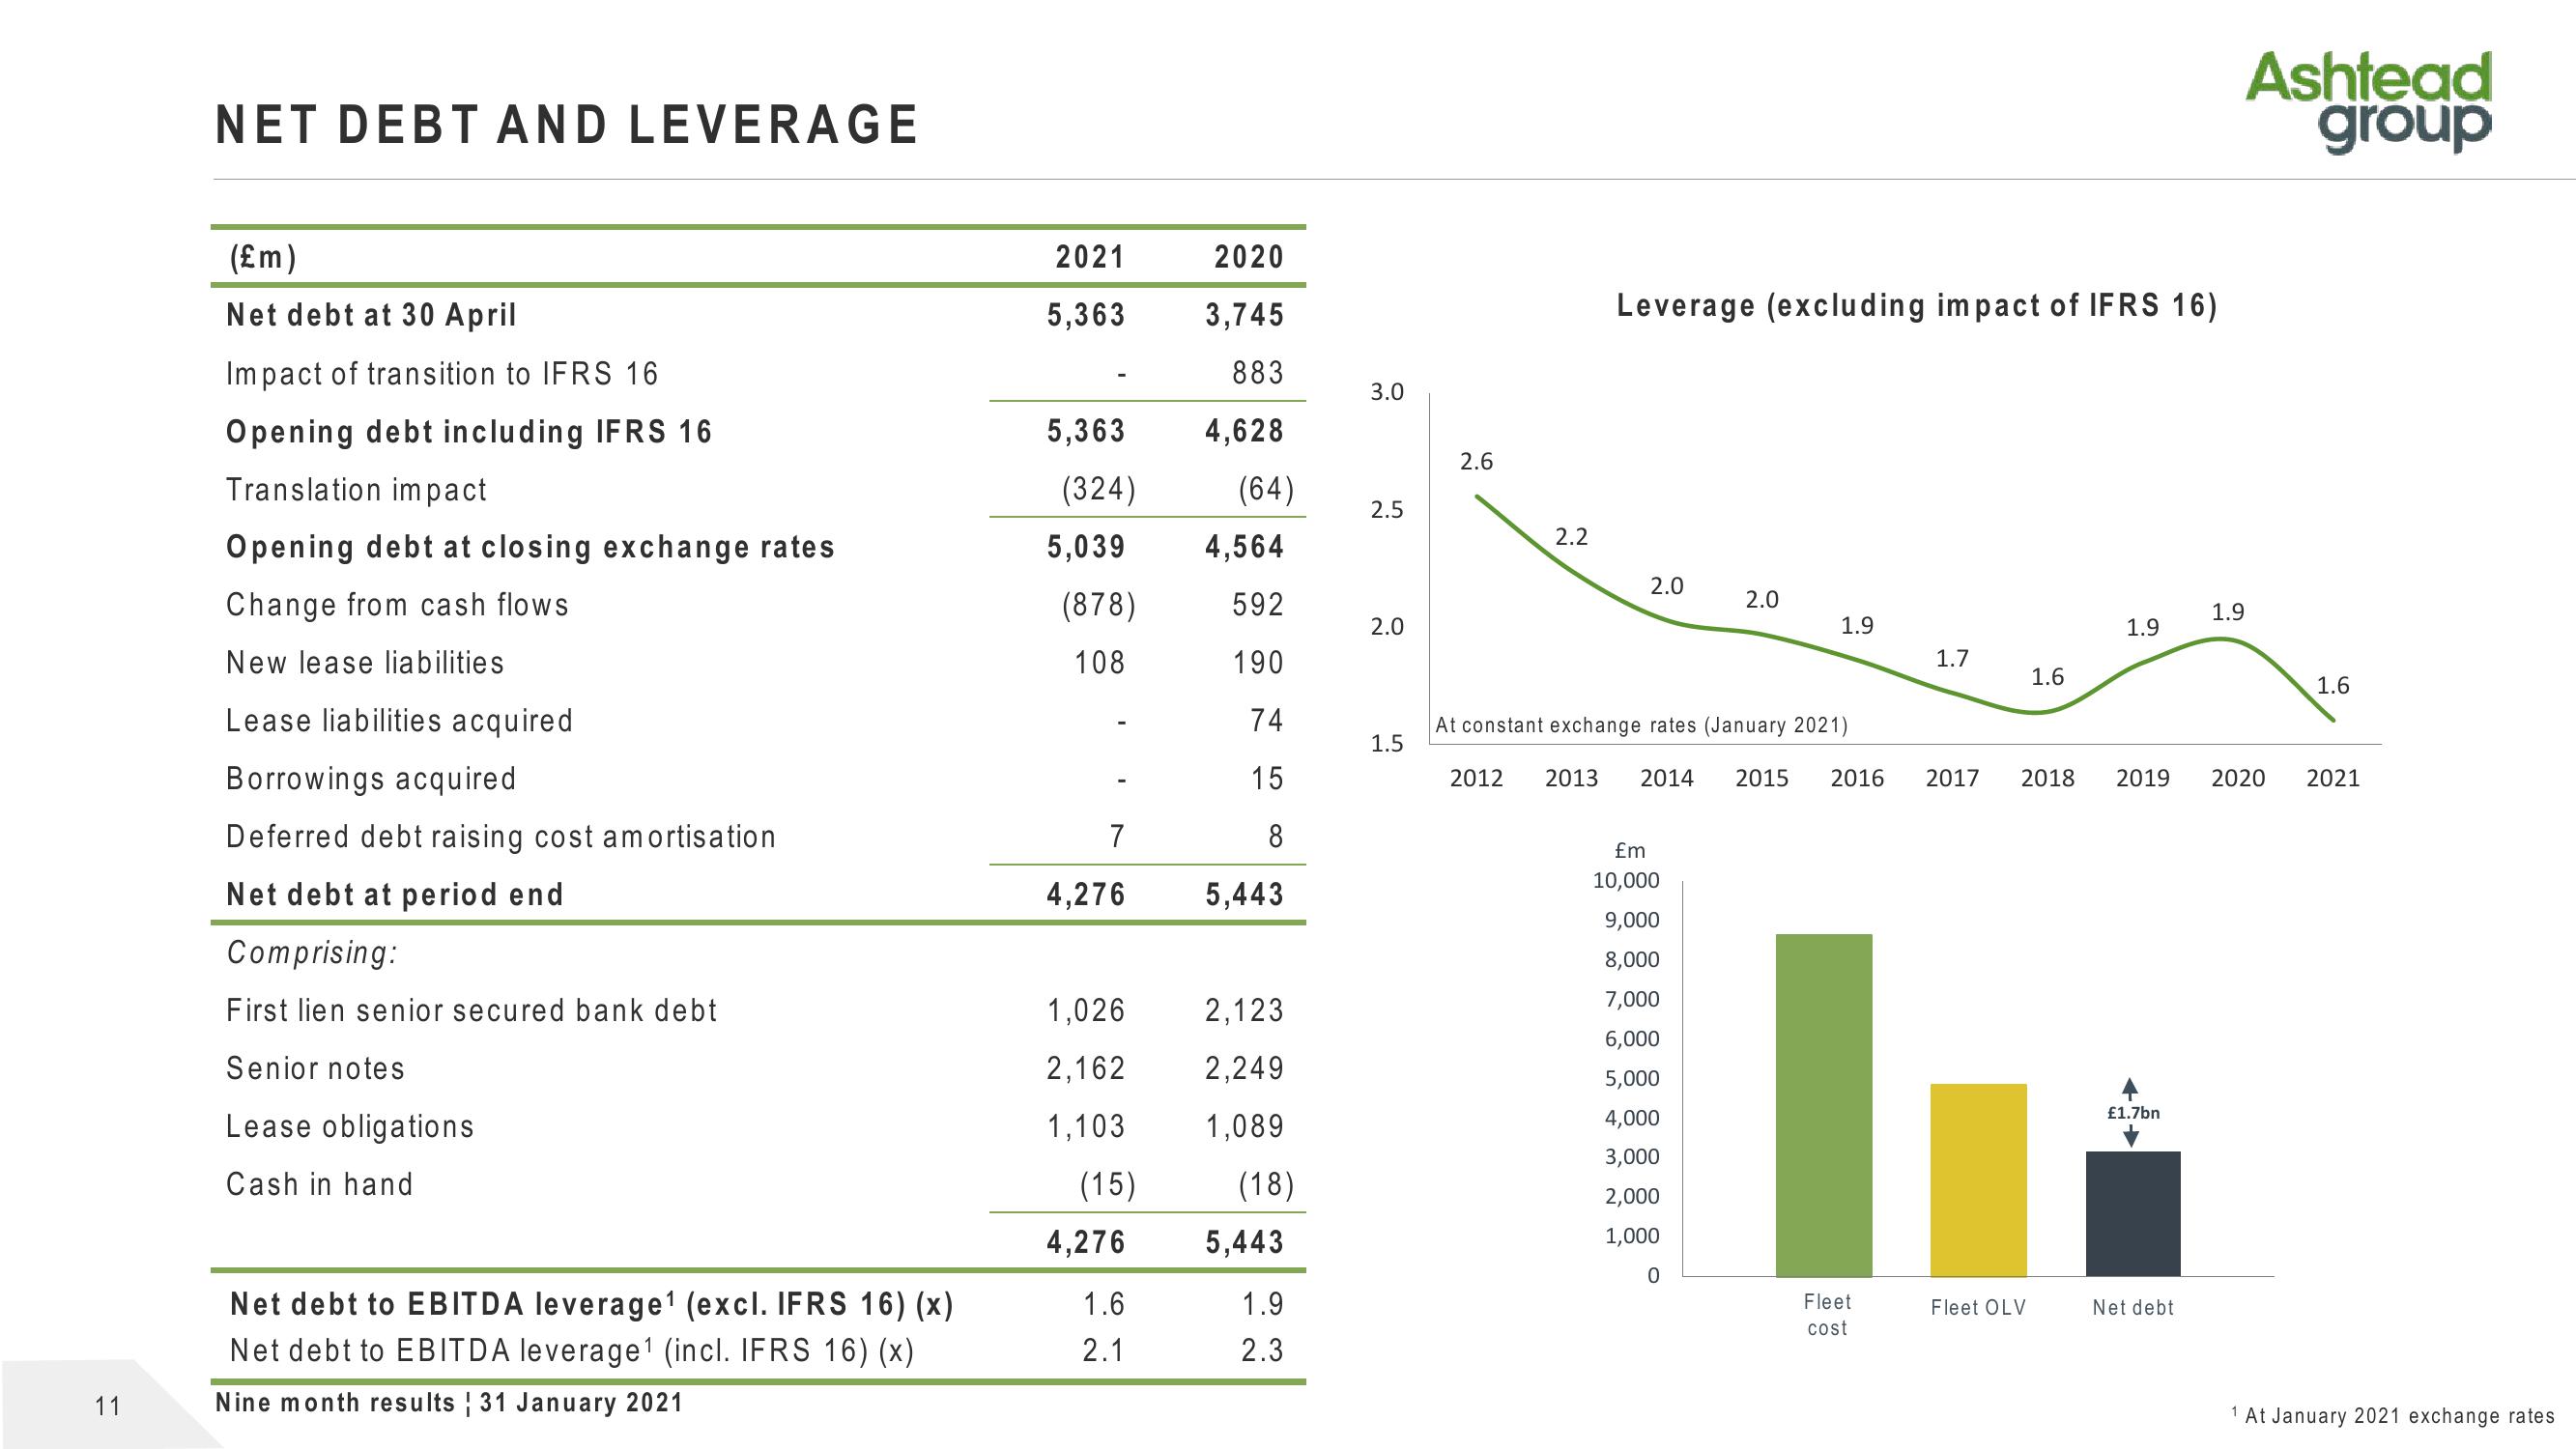
NET DEBT AND LEVERAGE
(£m)
Net debt at 30 April
Impact of transition to IFRS 16
Opening debt including IFRS 16
Translation impact
Opening debt at closing exchange rates
Change from cash flows
New lease liabilities
Lease liabilities acquired
Borrowings acquired
Deferred debt raising cost amortisation
Net debt at period end
Comprising:
First lien senior secured bank debt
Senior notes
Lease obligations
Cash in hand
Net debt to EBITDA leverage¹ (excl. IFRS 16) (x)
Net debt to EBITDA leverage¹ (incl. IFRS 16) (x)
Nine month results 31 January 2021
2021
5,363
5,363
(324)
5,039
(878)
108
7
4,276
1,026
2,162
1,103
(15)
4,276
1.6
2.1
2020
3,745
883
4,628
(64)
4,564
592
190
74
15
8
5,443
2,123
2,249
1,089
(18)
5,443
1.9
2.3
3.0
2.5
2.0
1.5
2.6
2.2
Leverage (excluding impact of IFRS 16)
2.0
2.0
£m
10,000
9,000
8,000
7,000
6,000
5,000
4,000
3,000
2,000
1,000
0
1.9
1.7
Fleet
cost
At constant exchange rates (January 2021)
2012 2013 2014 2015 2016 2017 2018 2019
1.6
Fleet OLV
1.9
£1.7bn
Net debt
1.9
Ashtead
group
2020
1.6
2021
1 At January 2021 exchange ratesView entire presentation