Grab Results Presentation Deck
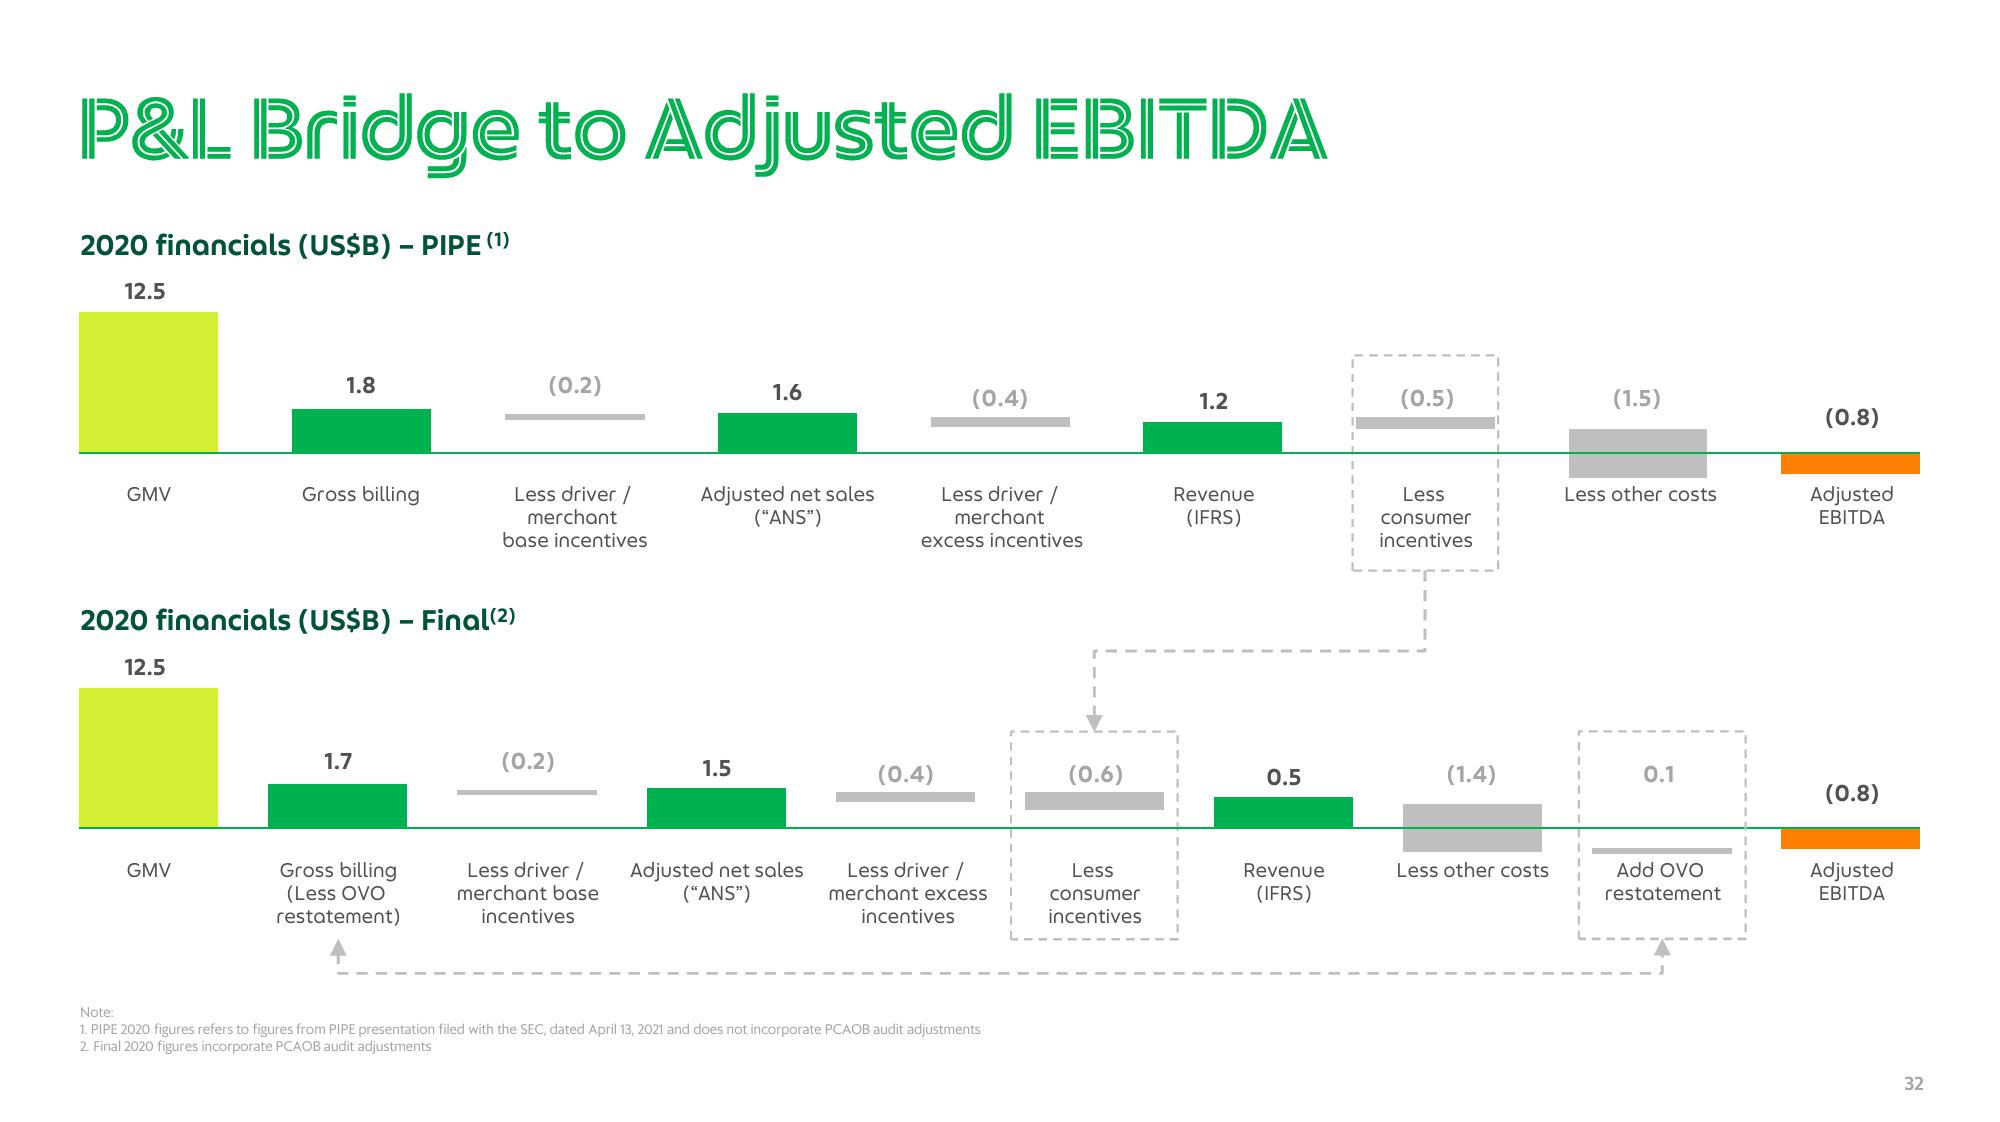
P&L Bridge to Adjusted EBITDA
2020 financials (US$B) - PIPE (¹)
12.5
GMV
12.5
1.8
GMV
Gross billing
2020 financials (US$B) - Final (2)
1.7
Gross billing
(Less OVO
restatement)
(0.2)
Less driver /
merchant
base incentives
(0.2)
Less driver /
merchant base
incentives
1.6
Adjusted net sales
("ANS")
1.5
Adjusted net sales
("ANS")
(0.4)
Less driver /
merchant
excess incentives
(0.4)
Less driver /
merchant excess
incentives
Note:
1. PIPE 2020 figures refers to figures from PIPE presentation filed with the SEC, dated April 13, 2021 and does not incorporate PCAOB audit adjustments
2. Final 2020 figures incorporate PCAOB audit adjustments
(0.6)
Less
consumer
incentives
1.2
Revenue
(IFRS)
0.5
Revenue
(IFRS)
(0.5)
Less
consumer
incentives
(1.4)
Less other costs
(1.5)
Less other costs
0.1
Add OVO
restatement
(0.8)
Adjusted
EBITDA
(0.8)
Adjusted
EBITDA
32View entire presentation