Dave Investor Day Presentation Deck
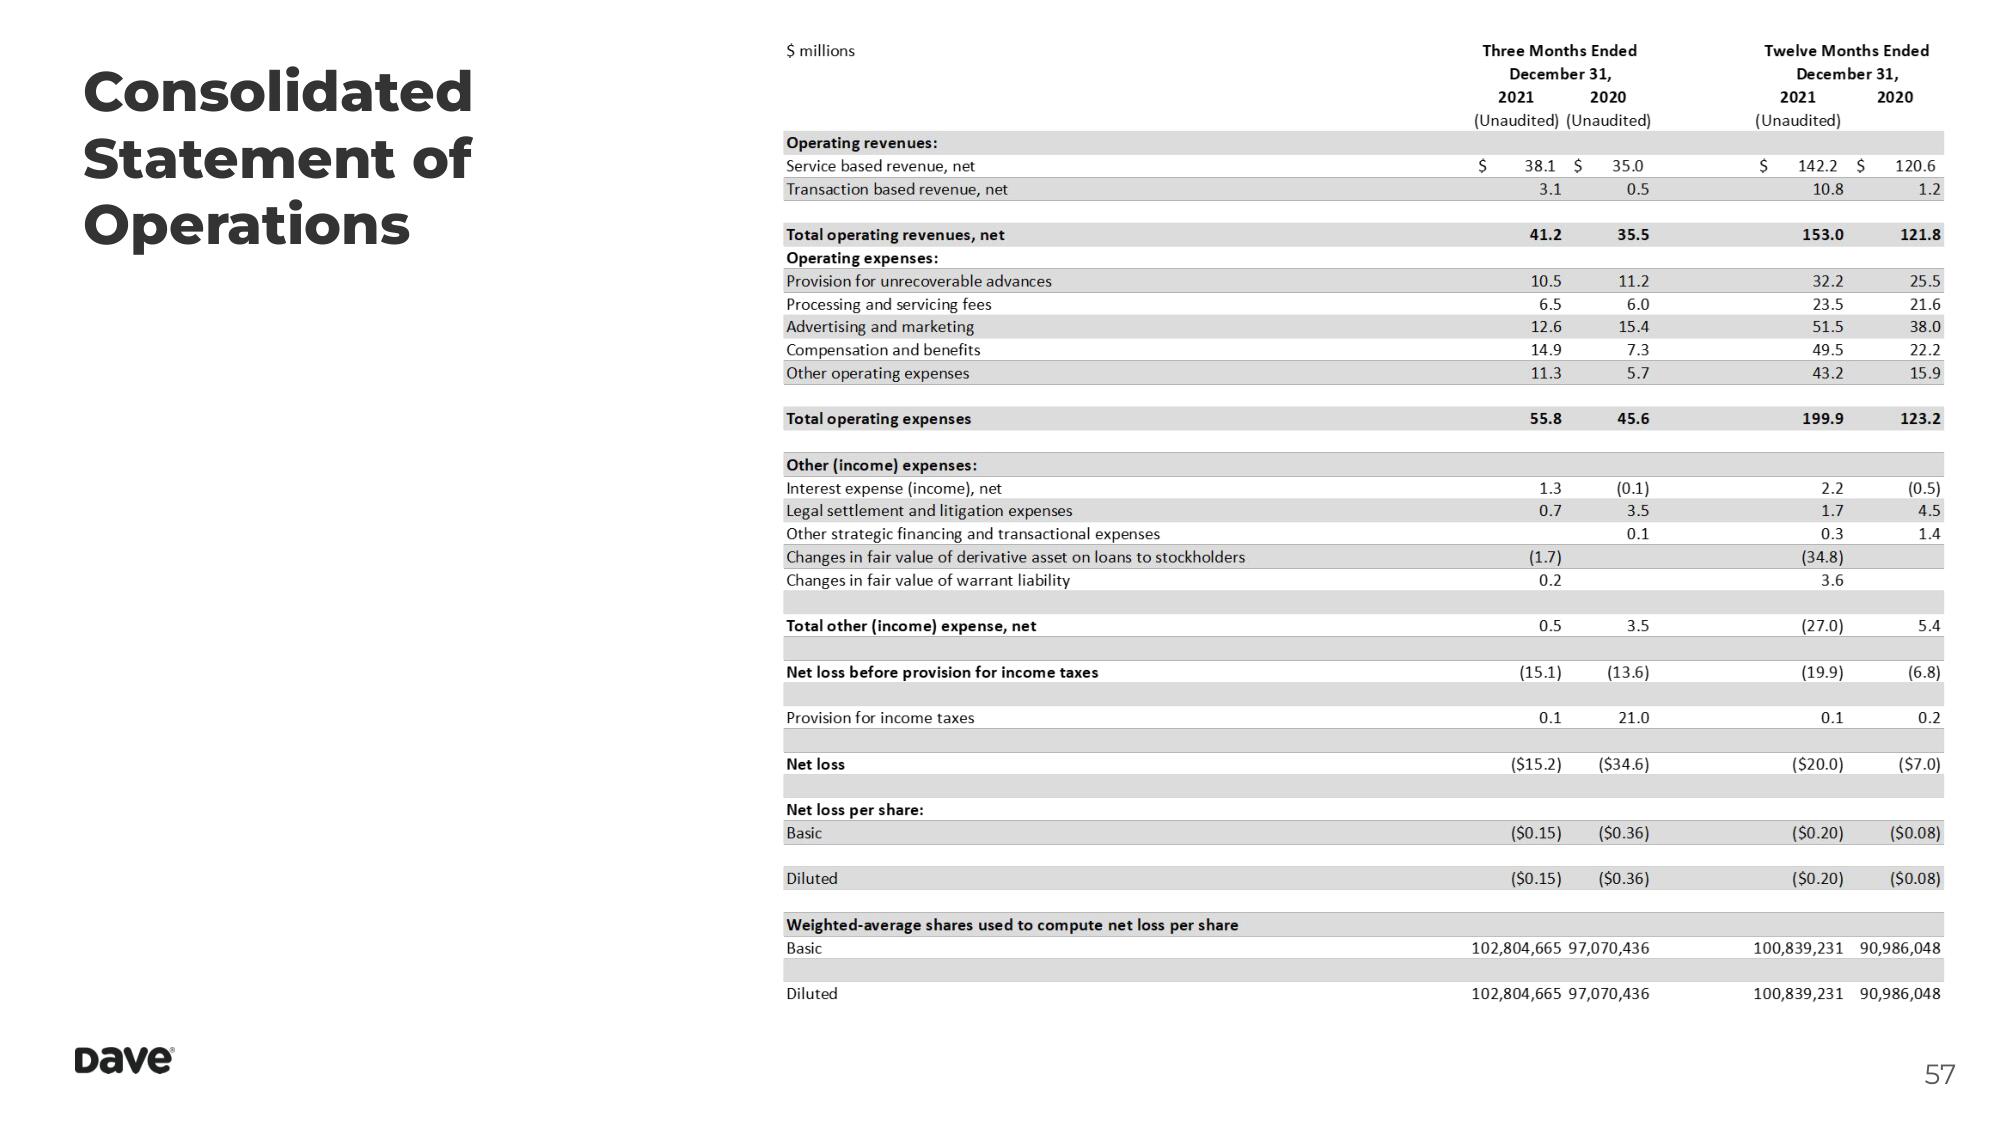
Consolidated
Statement of
Operations
Dave
$ millions
Operating revenues:
Service based revenue, net
Transaction based revenue, net
Total operating revenues, net
Operating expenses:
Provision for unrecoverable advances
Processing and servicing fees
Advertising and marketing
Compensation and benefits.
Other operating expenses
Total operating expenses
Other (income) expenses:
Interest expense (income), net
Legal settlement and litigation expenses
Other strategic financing and transactional expenses
Changes in fair value of derivative asset on loans to stockholders
Changes in fair value of warrant liability
Total other (income) expense, net
Net loss before provision for income taxes
Provision for income taxes
Net loss
Net loss per share:
Basic
Diluted
Weighted-average shares used to compute net loss per share
Basic
Diluted
Three Months Ended
December 31,
2021
2020
(Unaudited) (Unaudited)
$
38.1 $ 35.0
3.1
0.5
41.2
10.5
6.5
12.6
14.9
11.3
55.8
1.3
0.7
SE
(1.7)
0.2
0.5
(15.1)
0.1
($15.2)
($0.15)
($0.15)
35.5
11.2
6.0
15.4
7.3
5.7
45.6
(0.1)
3.5
0.1
3.5
(13.6)
21.0
($34.6)
($0.36)
($0.36)
102,804,665 97,070,436
102,804,665 97,070,436
Twelve Months Ended
December 31,
2021
(Unaudited)
$
142.2 $ 120.6
10.8
1.2
153.0
32.2
23.5
51.5
49.5
43.2
199.9
2.2
1.7
0.3
(34.8)
3.6
(27.0)
(19.9)
0.1
($20.0)
($0.20)
2020
($0.20)
121.8
25.5
21.6
38.0
22.2
15.9
123.2
(0.5)
4.5
1.4
5.4
(6.8)
0.2
($7.0)
($0.08)
($0.08)
100,839,231 90,986,048
100,839,231 90,986,048
57View entire presentation