DiDi IPO Presentation Deck slide image

DiDi IPO Presentation Deck

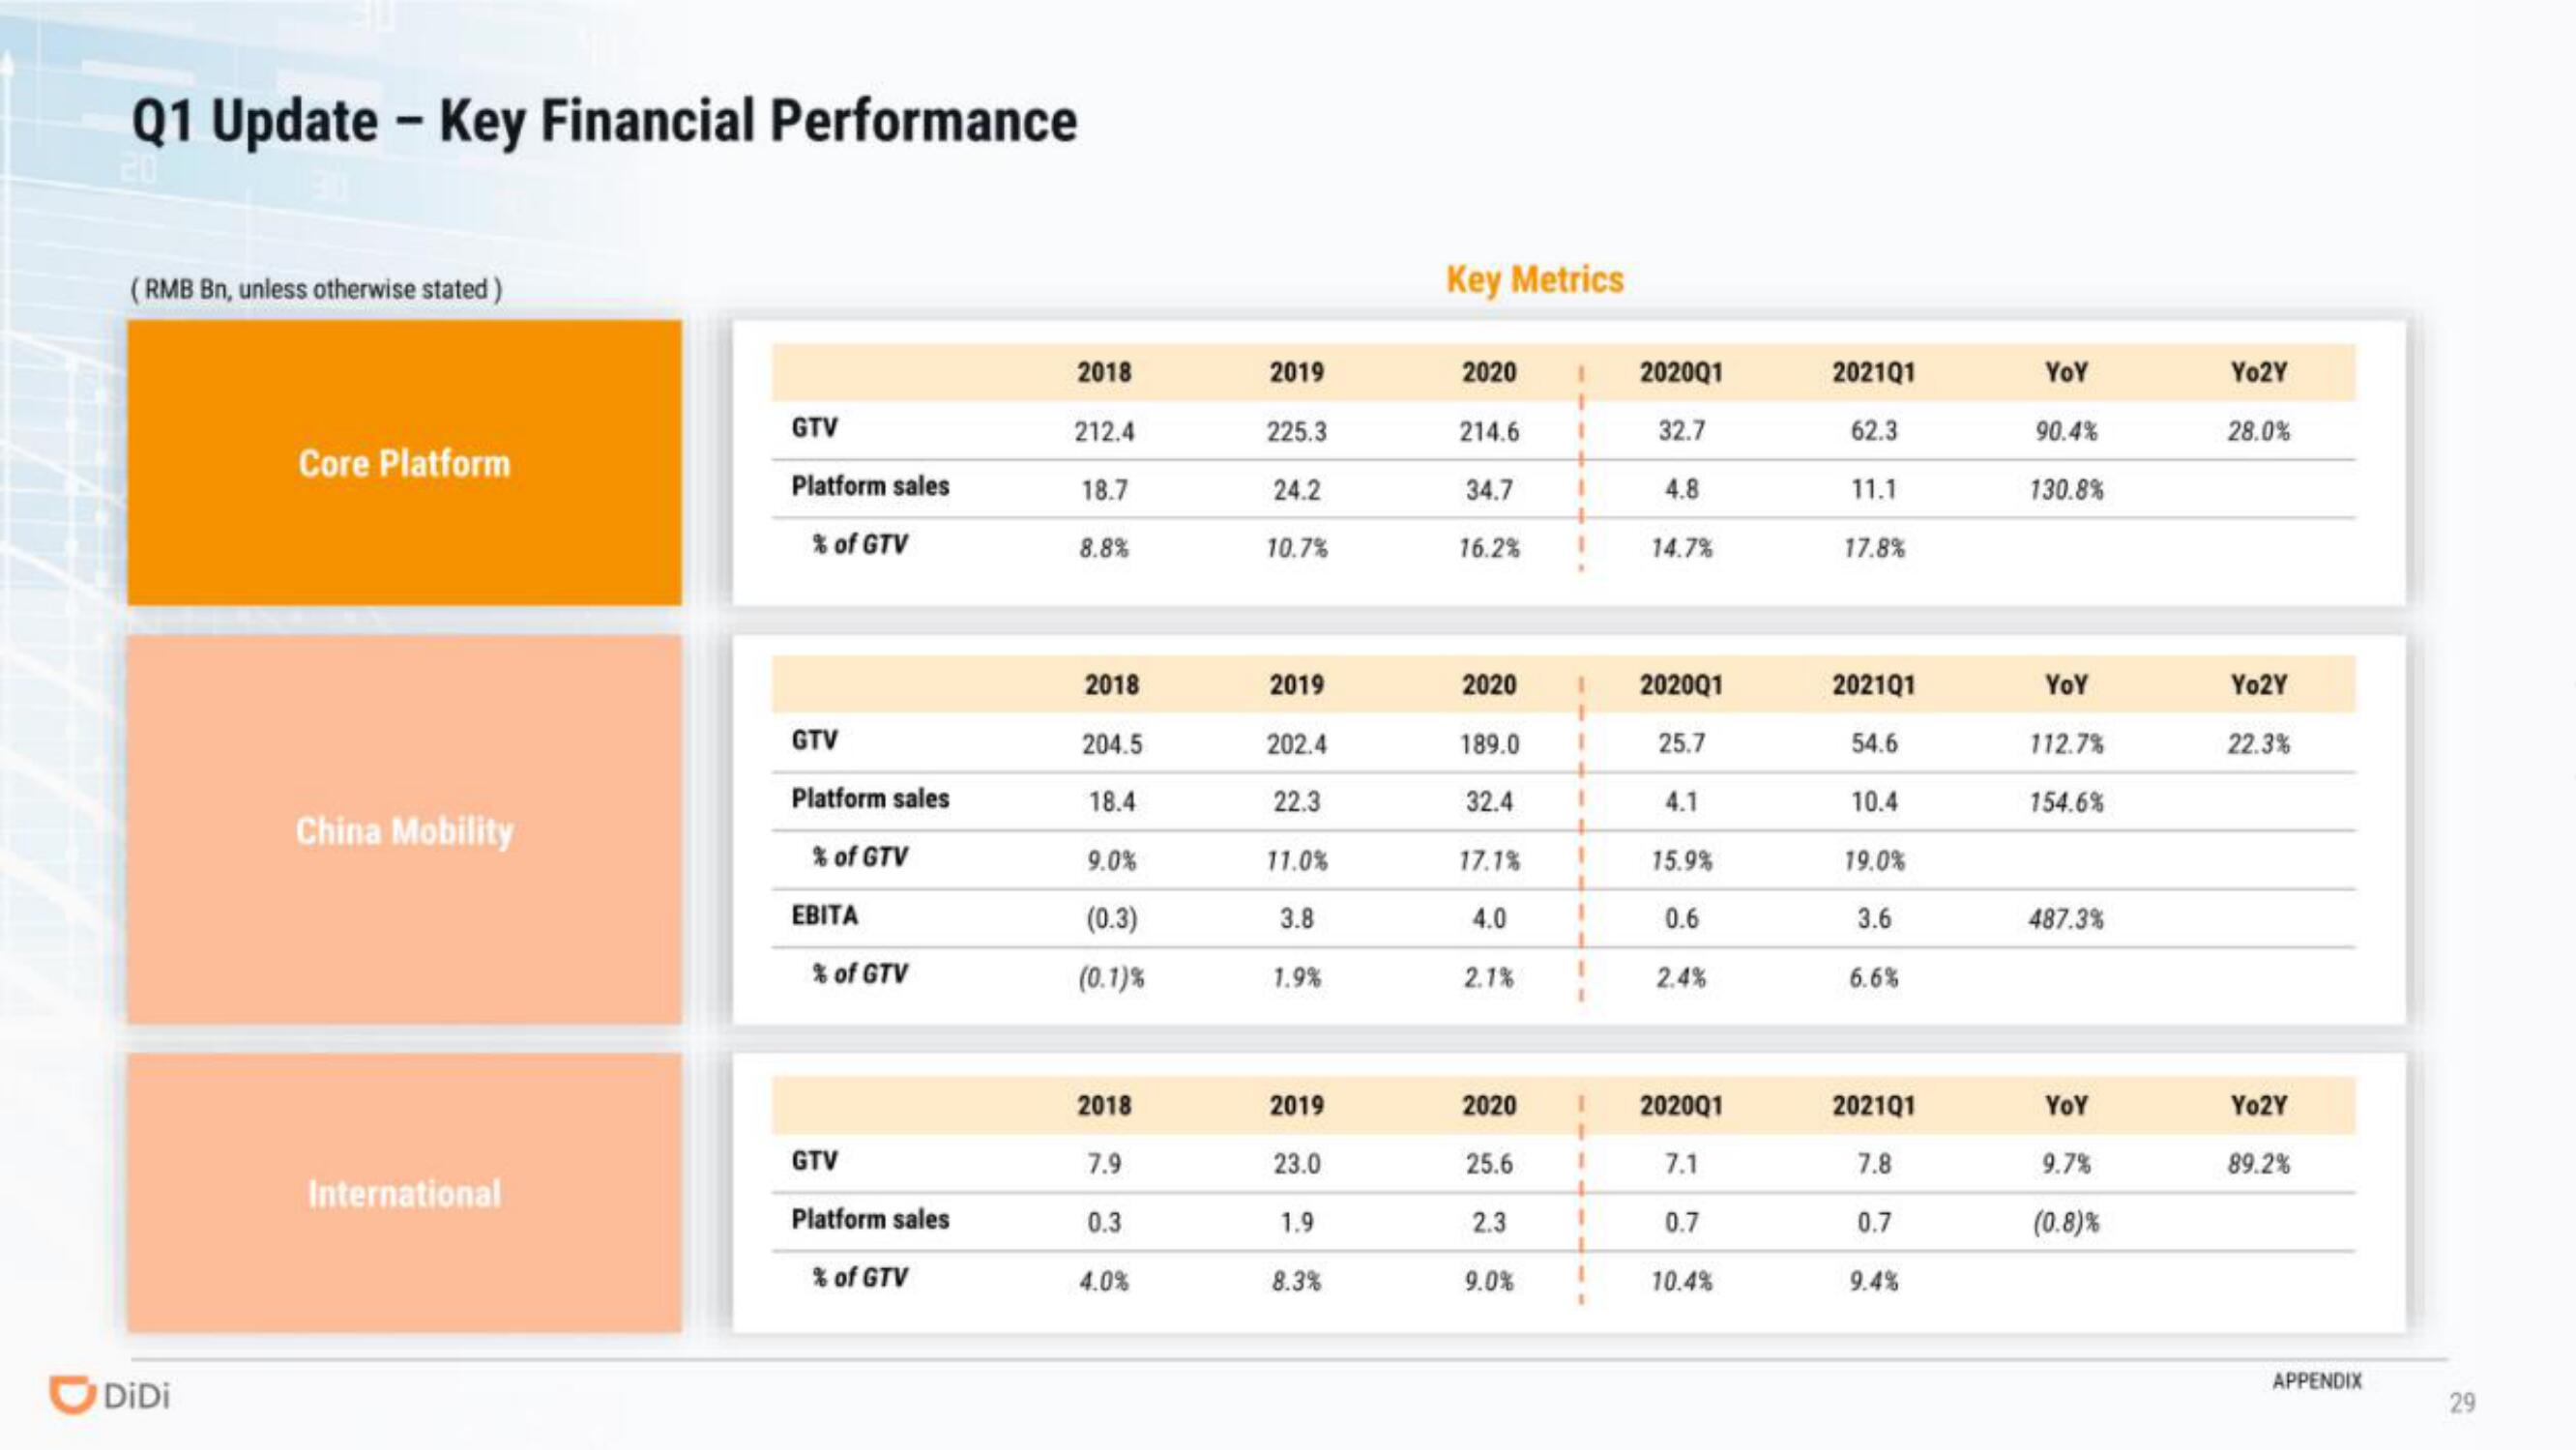
Q1 Update - Key Financial Performance (RMB Bn, unless otherwise stated) DiDi Core Platform China Mobility International GTV Platform sales % of GTV GTV Platform sales % of GTV EBITA % of GTV GTV Platform sales % of GTV 2018 212.4 18.7 8.8% 2018 204.5 18.4 9.0% (0.3) (0.1)% 2018 7.9 0.3 4.0% 2019 225.3 24.2 10.7% 2019 202.4 22.3 11.0% 3.8 1.9% 2019 23.0 1.9 8.3% Key Metrics 2020 214.6 34.7 16.2% 2020 189.0 32.4 17.1% 4.0 2.1% 2020 25.6 2.3 9.0% 202001 32.7 4.8 14.7% 202001 25.7 4.1 15.9% 0.6 2.4% 202001 7.1 0.7 10.4% 202101 62.3 11.1 17.8% 202101 54.6 10.4 19.0% 3.6 6.6% 202101 7.8 0.7 9.4% YOY 90.4% 130.8% YOY 112.7% 154.6% 487.3% YOY 9.7% (0.8)% Yo2Y 28.0% Yo2Y 22.3% Yo2Y 89.2% APPENDIX 29
View entire presentation