Kymera Investor Presentation Deck
% Change from C1D1 Predose (Mean ± SEM)
400
300
200
400
300
200
200
100
50
0-
-25
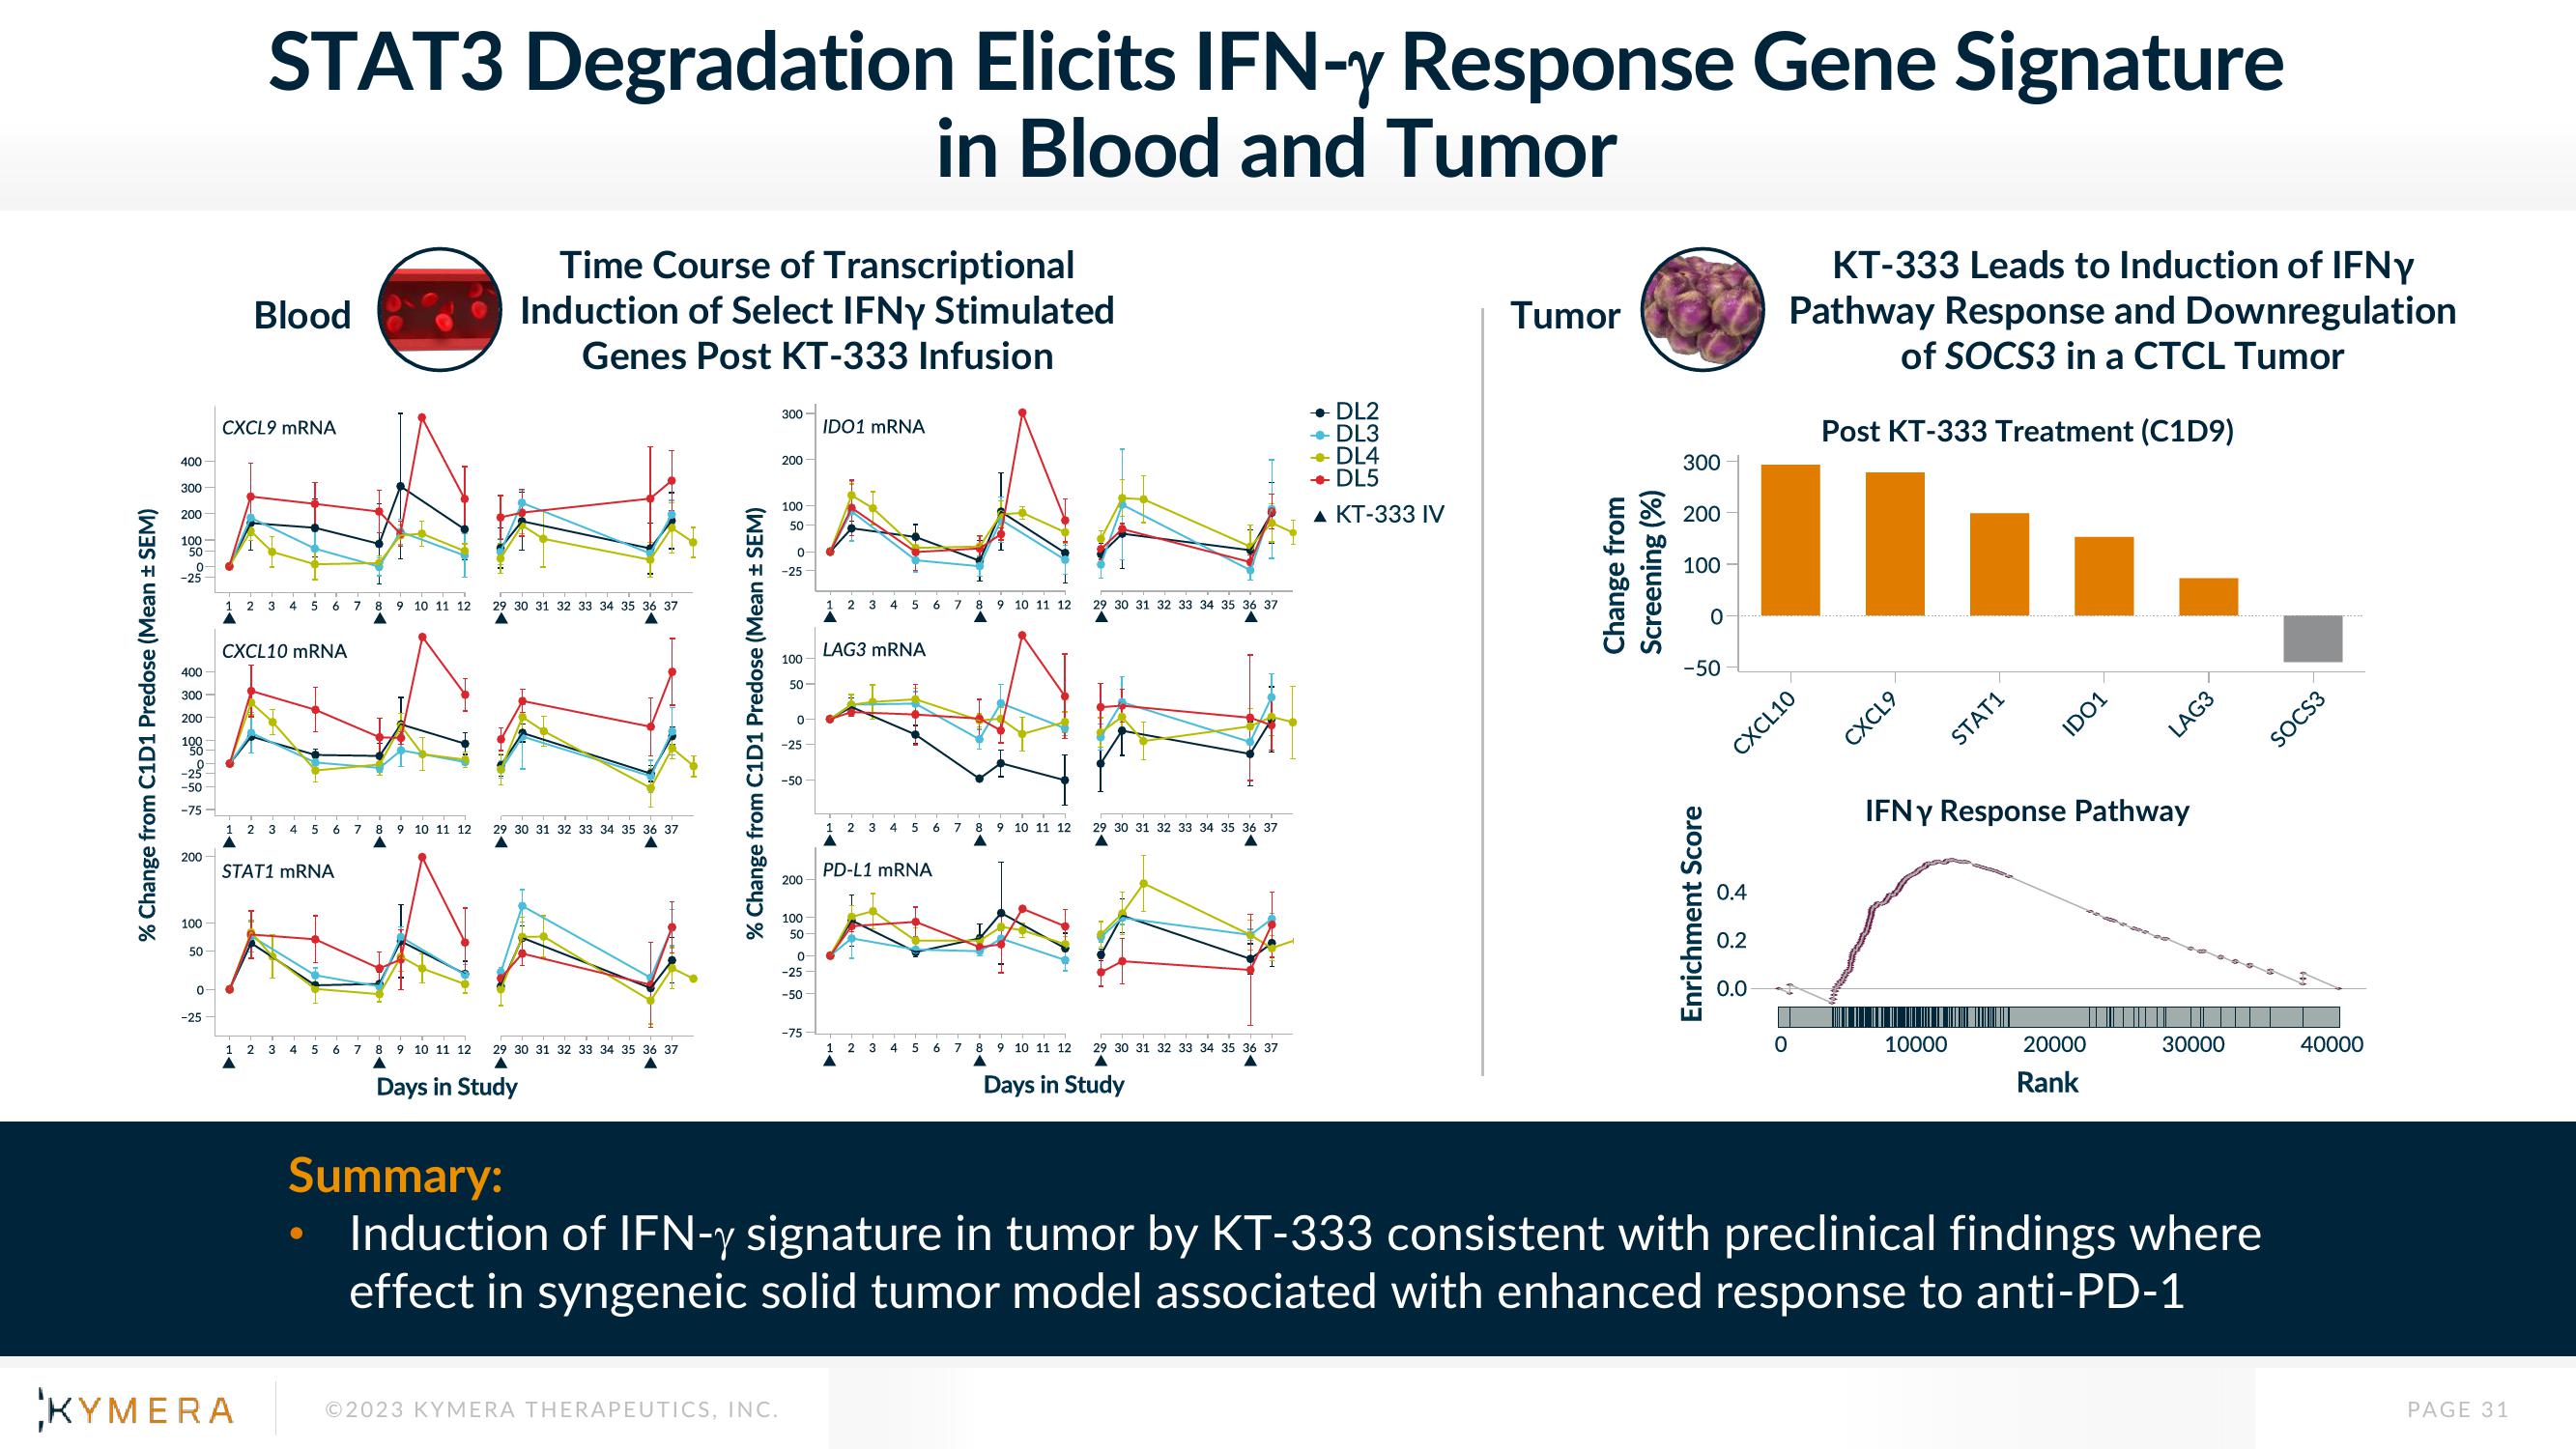
STAT3 Degradation Elicits IFN-y Response Gene Signature
in Blood and Tumor
Blood
CXCL9 mRNA
2 3 4 5 6 7 8
CXCL10 mRNA
KYMERA
2
3 4 5 6
STAT1 mRNA
1 2 3
4
5
●
6
7
7
9 10 11 12
8 9 10 11 12
A
Time Course of Transcriptional
Induction of Select IFNy Stimulated
Genes Post KT-333 Infusion
8 9 10 11 12
A
29 30 31 32 33 34 35 36 37
29 30 31 32 33 34 35 36 37
29 30 31 32 33 34 35 36 37
A
Days in Study
% Change from C1D1 Predose (Mean ± SEM)
300-
©2023 KYMERA THERAPEUTICS, INC.
200
100
50
0
-25
100
50-
0-
-25
-50
200
100
50
0
-25
-50
-75
IDO1 mRNA
2 3
LAG3 mRNA
1
4 5 6 7
2 3 4 5 6
PD-L1 mRNA
2
3
4
5
6
7
7
8 9 10 11 12
8 9 10 11 12
29 30 31 32 33 34 35 36 37
8
A
29 30 31 32 33 34 35 36 37
9 10 11 12
Days in Study
29 30 31 32 33 34 35 36 37
DL2
DL3
DL4
DL5
A KT-333 IV
+
Tumor
Change from
Screening (%)
300
200
100
0
-50
Enrichment Score
0.4
11
0.2
0.0
KT-333 Leads to Induction of IFNY
Pathway Response and Downregulation
of SOCS3 in a CTCL Tumor
CXCL10
JO
Post KT-333 Treatment (C1D9)
CXCL9
STAT1
10000
IFN y Response Pathway
20000
IDO1
Rank
LAG3
Summary:
Induction of IFN-y signature in tumor by KT-333 consistent with preclinical findings where
effect in syngeneic solid tumor model associated with enhanced response to anti-PD-1
30000
SOCS3
40000
PAGE 31View entire presentation