Tesla Results Presentation Deck
9
OTHER HIGHLIGHTS
Energy Storage
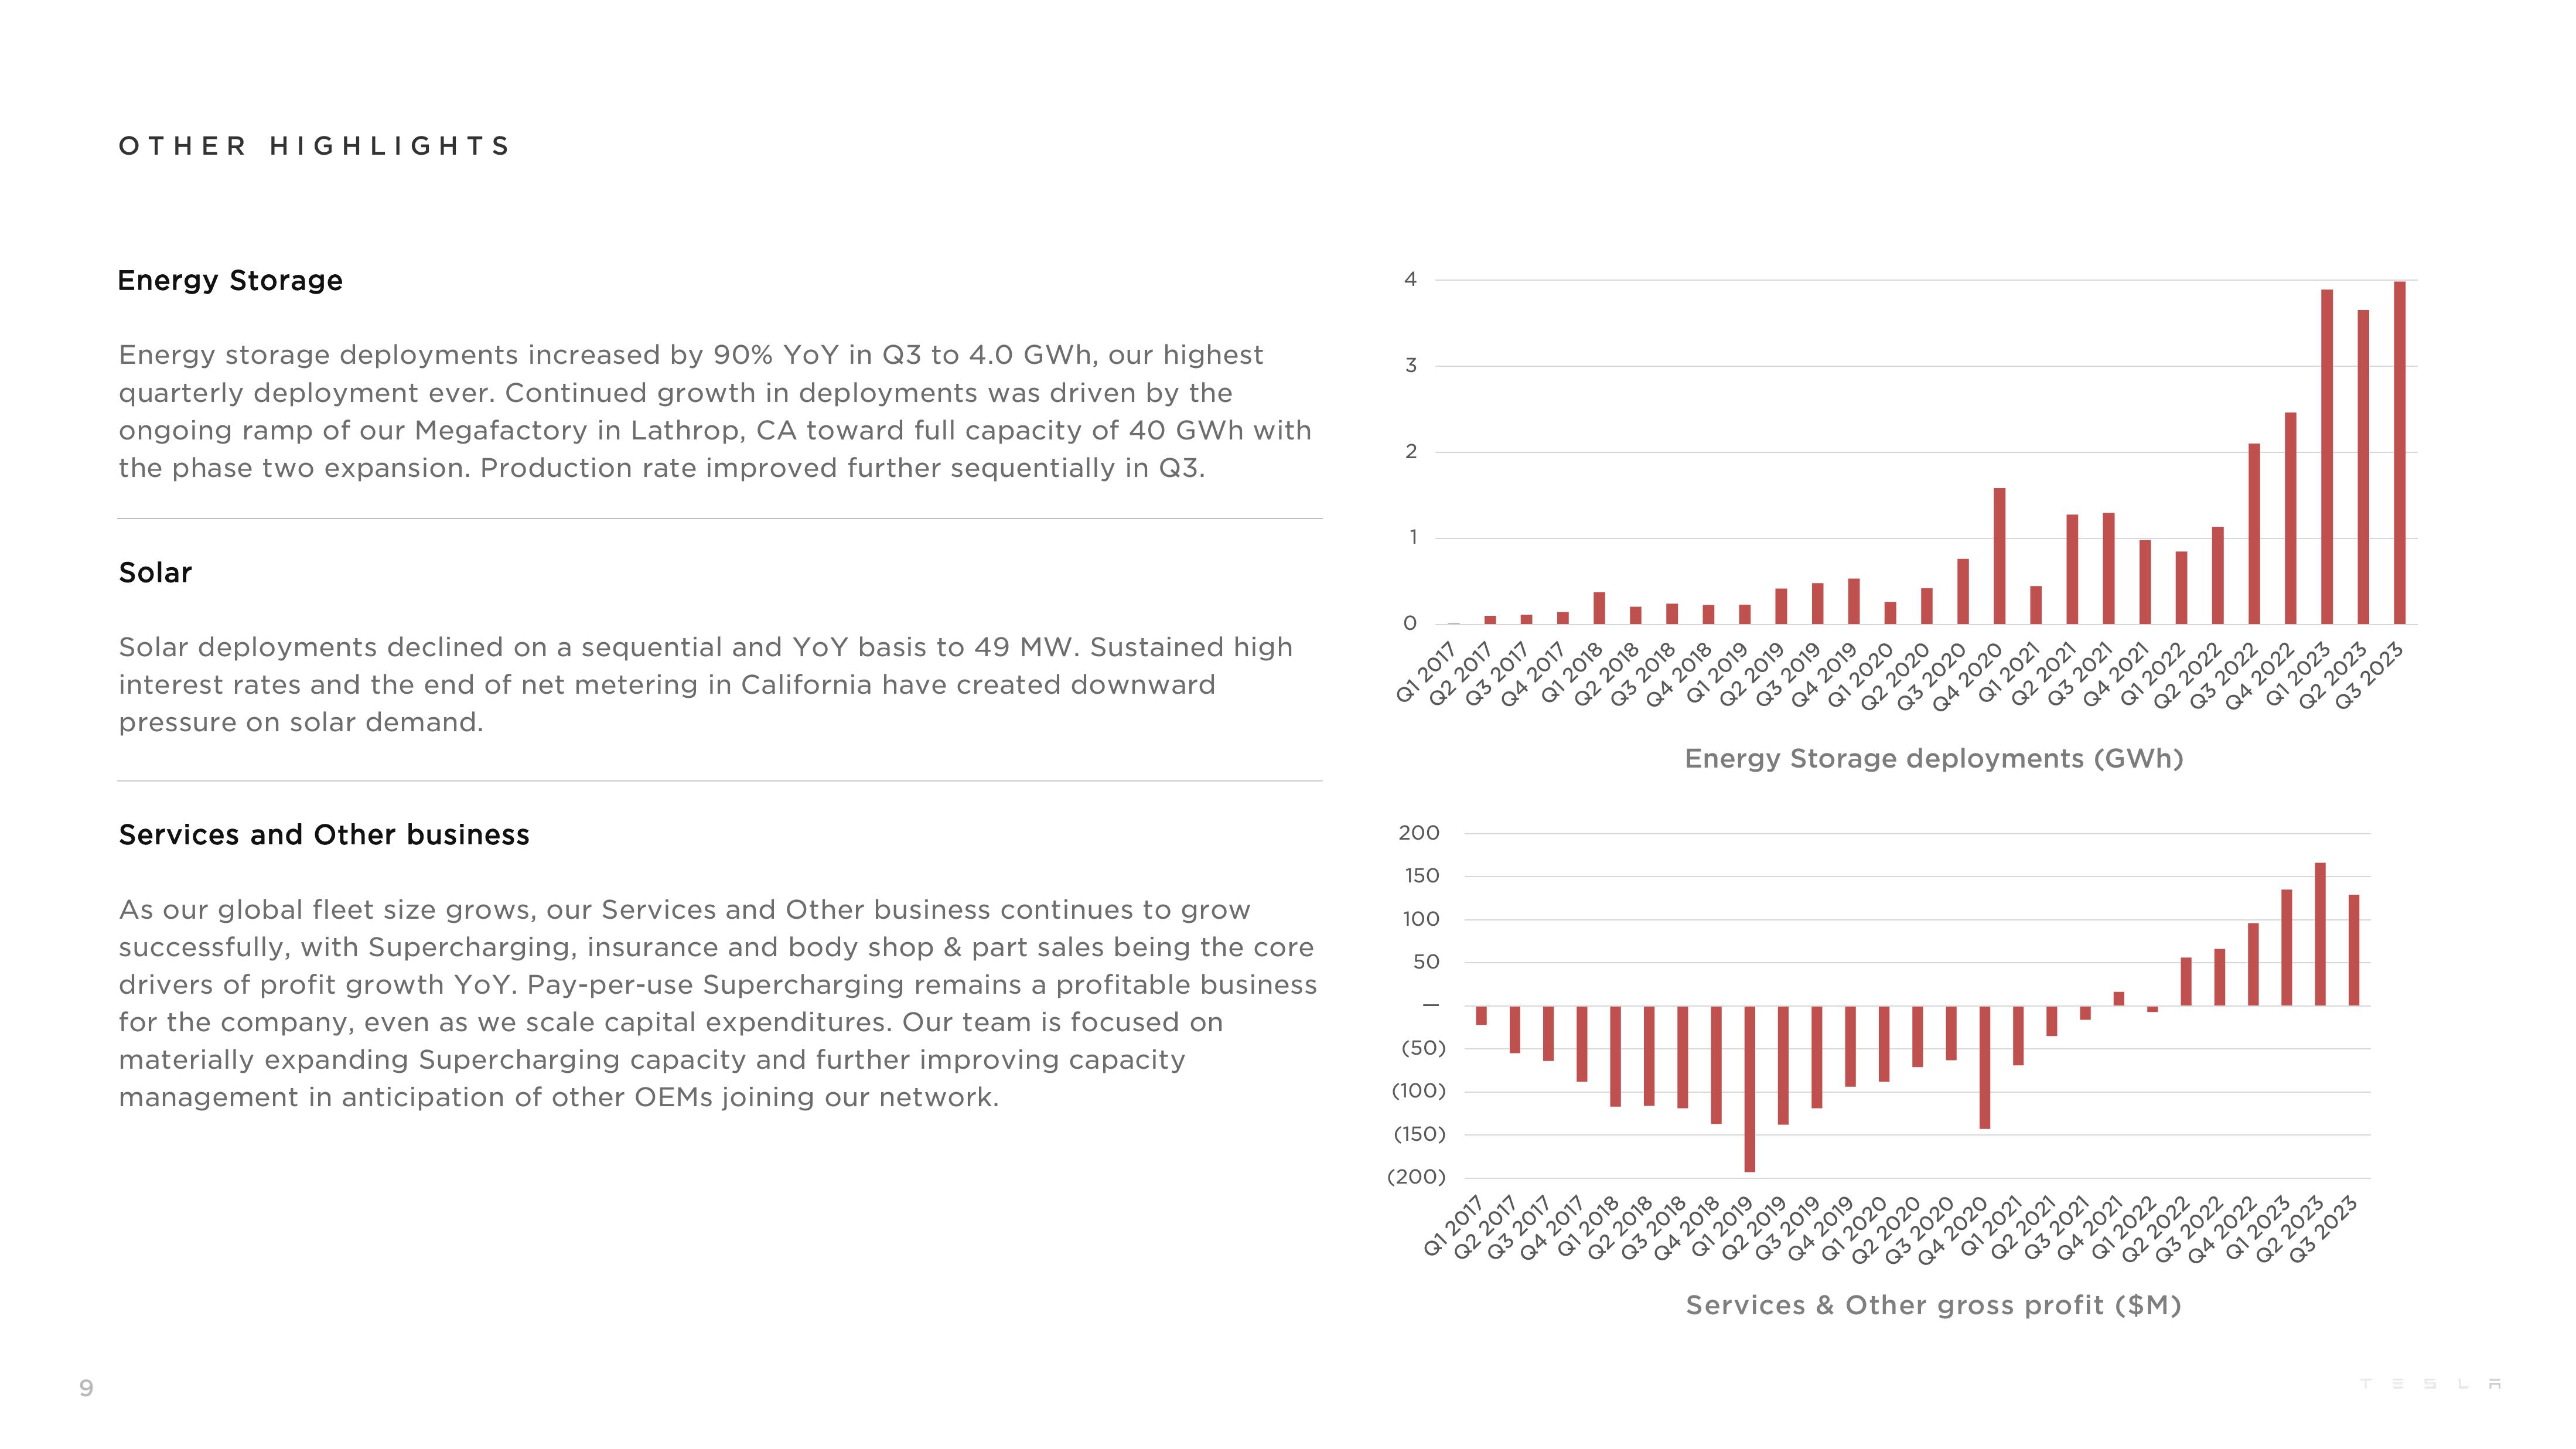
Energy storage deployments increased by 90% YoY in Q3 to 4.0 GWh, our highest
quarterly deployment ever. Continued growth in deployments was driven by the
ongoing ramp of our Megafactory in Lathrop, CA toward full capacity of 40 GWh with
the phase two expansion. Production rate improved further sequentially in Q3.
Solar
Solar deployments declined on a sequential and YoY basis to 49 MW. Sustained high
interest rates and the end of net metering in California have created downward
pressure on solar demand.
Services and Other business
As our global fleet size grows, our Services and Other business continues to grow
successfully, with Supercharging, insurance and body shop & part sales being the core
drivers of profit growth YoY. Pay-per-use Supercharging remains a profitable business
for the company, even as we scale capital expenditures. Our team is focused on
materially expanding Supercharging capacity and further improving capacity
management in anticipation of other OEMs joining our network.
4
3
2
1
O
200
150
100
50
Q1 2017
(50)
(100)
(150)
(200)
Q2 2017
Q1 2017
Q3 2017
Q2 2017
Q4 2017
Q1 2018
Q3 2017
Q4 2017
Q1 2018
Q2 2018
Q3 2018
Q4 2018
Q2 2018
Q3 2018
Q1 2019
Q4 2018
Q2 2019
Q1 2019
Q3 2019
Q2 2019
Q4 2019
Q3 2019
Q1 2020
Q4 2019
Q2 2020
Q1 2020
Energy Storage deployments (GWh)
Q3 2020
Q2 2020
Q4 2020
Q3 2020
Q4 2020
Q1 2021
Q1 2021
Q2 2021
Q3 2021
Q2 2021
Q3 2021
Q4 2021
Q4 2021
Q1 2022
Q1 2022
Q2 2022
Q2 2022
Services & Other gross profit ($M)
/////
Q3 2022
Q4 2022
Q3 2022
Q4 2022
Q1 2023
Q1 2023
Q2 2023
Q3 2023
Q2 2023
Q3 2023
TESLAView entire presentation