Bank of America Results Presentation Deck
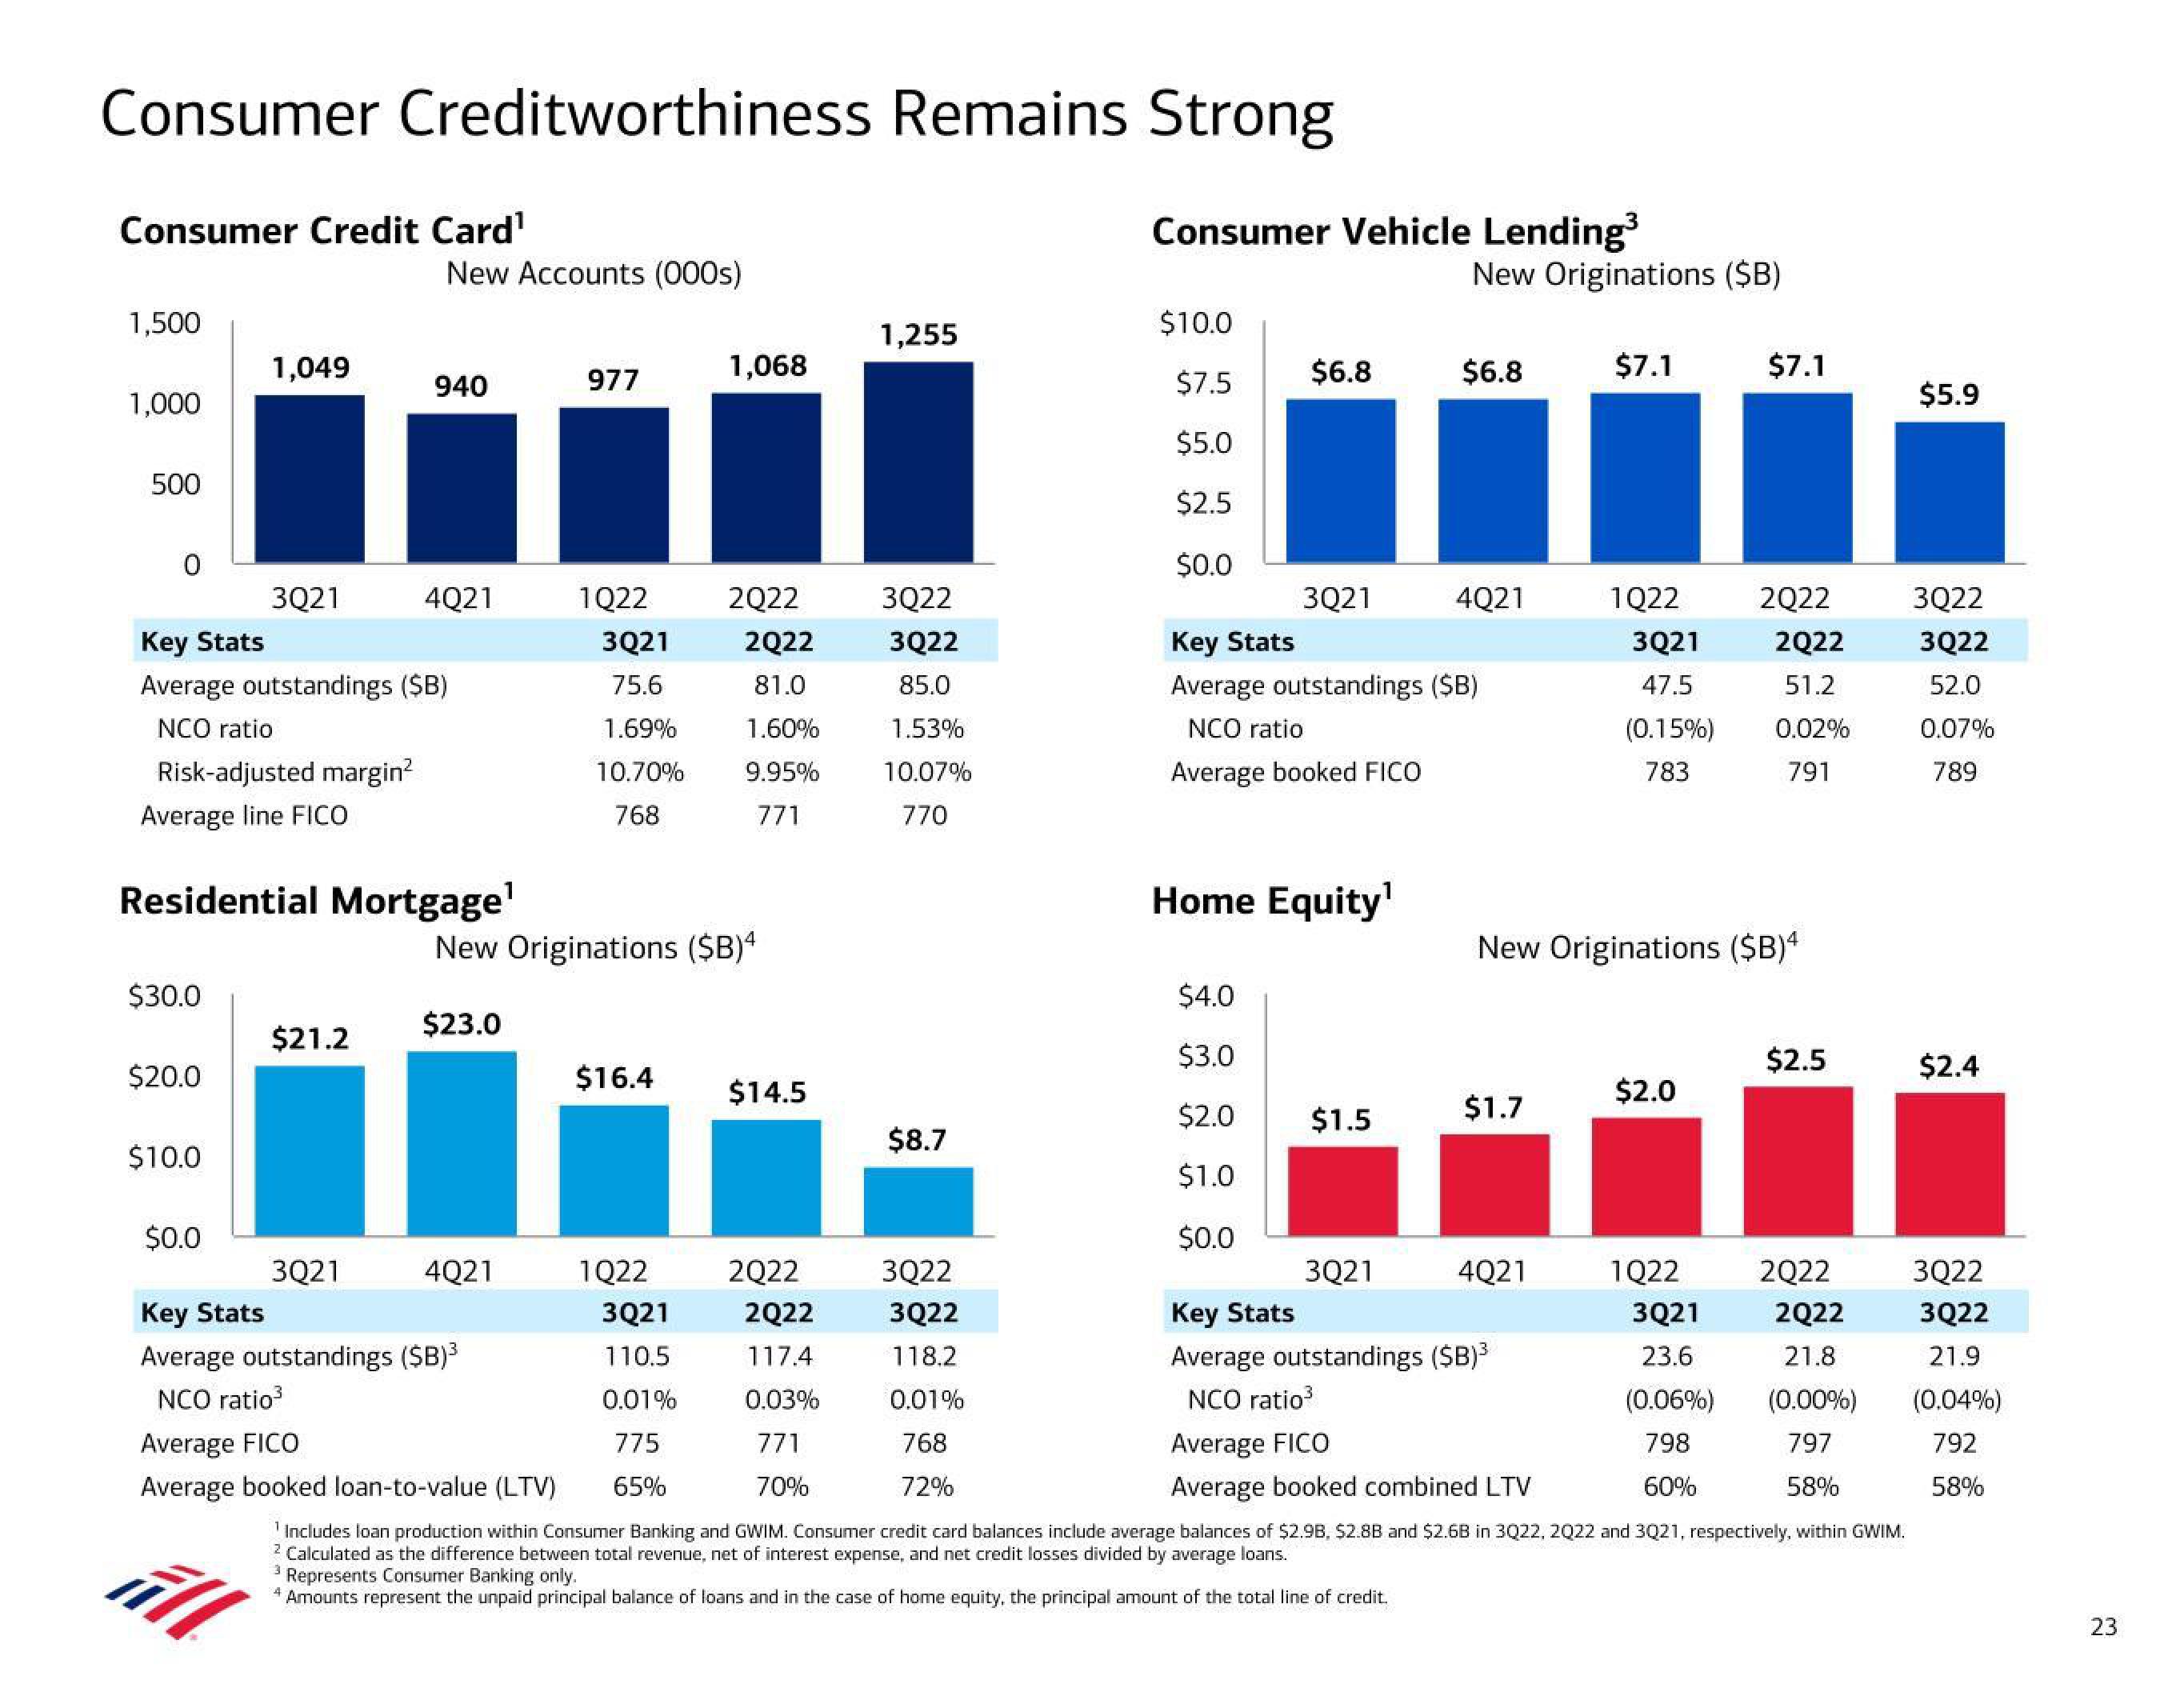
Consumer Creditworthiness Remains Strong
Consumer Credit Card¹
1,500
1,000
500
0
$30.0
$20.0
1,049
$10.0
3Q21
Key Stats
Average outstandings ($B)
NCO ratio
Risk-adjusted margin²
Average line FICO
$0.0
Residential Mortgage¹
New Accounts (000s)
$21.2
940
3Q21
4Q21
4Q21
Key Stats
Average outstandings ($B)³
NCO ratio³
977
1Q22
Average FICO
Average booked loan-to-value (LTV)
3Q21
75.6
1.69%
10.70%
768
New Originations ($B)4
$23.0
$16.4
1Q22
1,068
3Q21
110.5
0.01%
775
65%
2Q22
2Q22
81.0
1.60%
9.95%
771
$14.5
2Q22
2Q22
117.4
0.03%
771
70%
1,255
3Q22
3Q22
85.0
1.53%
10.07%
770
$8.7
3Q22
3Q22
118.2
0.01%
768
72%
Consumer Vehicle Lending³
$10.0
$7.5
$5.0
$2.5
$0.0
$6.8
3Q21
$4.0
$3.0
$2.0
$1.0
$0.0
Home Equity¹
Key Stats
Average outstandings ($B)
NCO ratio
Average booked FICO
$1.5
3Q21
New Originations ($B)
$6.8
4Q21
Represents Consumer Banking only.
4 Amounts represent the unpaid principal balance of loans and in the case of home equity, the principal amount of the total line of credit.
$1.7
4Q21
Key Stats
Average outstandings ($B)³
NCO ratio³
$7.1
Average FICO
Average booked combined LTV
1Q22
3Q21
47.5
(0.15%)
783
New Originations ($B)4
$2.0
1Q22
3Q21
23.6
$7.1
(0.06%)
798
60%
2Q22
2Q22
51.2
0.02%
791
$2.5
(0.00%)
797
58%
Includes loan production within Consumer Banking and GWIM. Consumer credit card balances include average balances of $2.9B, $2.8B and $2.6B in 3Q22, 2022 and 3Q21, respectively, within GWIM.
2 Calculated as the difference between total revenue, net of interest expense, and net credit losses divided by average loans.
2Q22
2Q22
21.8
$5.9
3Q22
3Q22
52.0
0.07%
789
$2.4
3Q22
3Q22
21.9
(0.04%)
792
58%
23View entire presentation