Kinnevik Results Presentation Deck
Intro
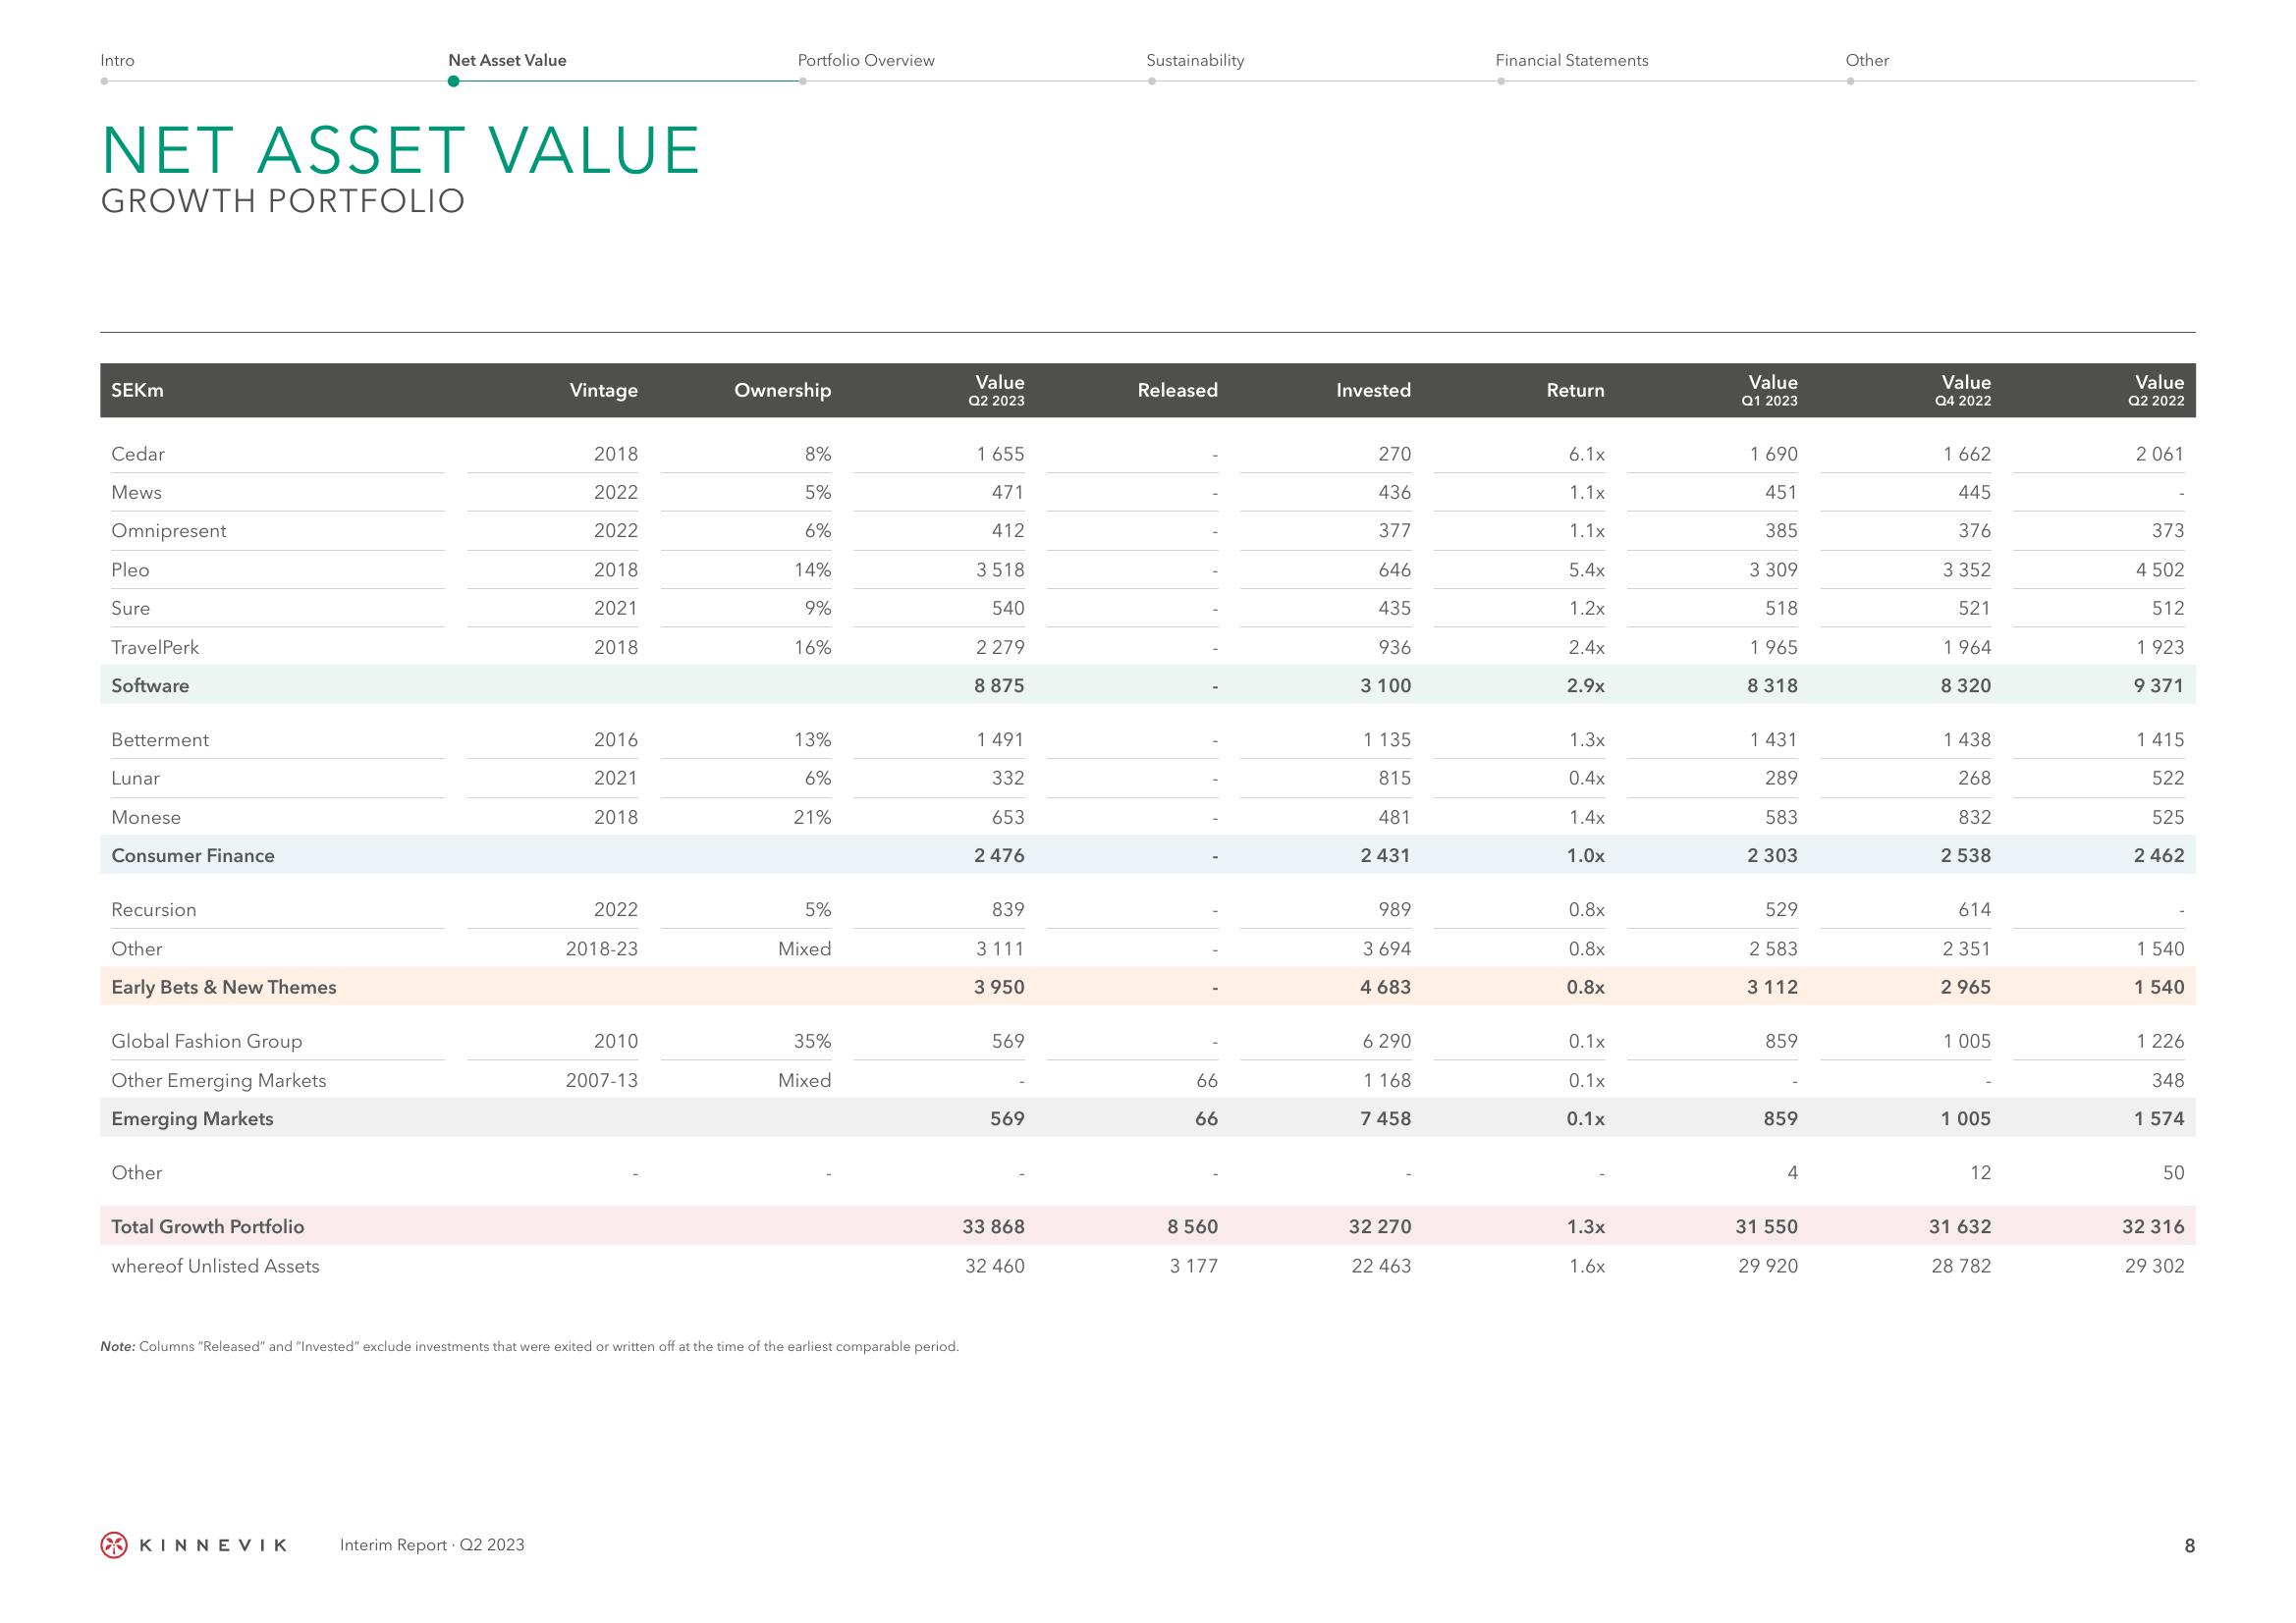
NET ASSET VALUE
GROWTH PORTFOLIO
SEKM
Cedar
Mews
Omnipresent
Pleo
Sure
TravelPerk
Software
Betterment
Lunar
Monese
Consumer Finance
Recursion
Other
Early Bets & New Themes
Global Fashion Group
Other Emerging Markets
Emerging Markets
Other
Total Growth Portfolio
whereof Unlisted Assets
Net Asset Value
KINNEVIK
Vintage
Interim Report Q2 2023
2018
2022
2022
2018
2021
2018
2016
2021
2018
2022
2018-23
2010
2007-13
Portfolio Overview
Ownership
8%
5%
6%
14%
9%
16%
13%
6%
21%
5%
Mixed
Note: Columns "Released" and "Invested" exclude investments that were exited or written off at the time of the earliest comparable period.
35%
Mixed
Value
Q2 2023
1 655
471
412
3518
540
2279
8 875
1 491
332
653
2 476
839
3111
3 950
569
569
33 868
32 460
Sustainability
Released
66
66
8 560
3 177
Invested
270
436
377
646
435
936
3 100
1 135
815
481
2 431
989
3 694
4 683
6 290
1 168
7 458
32 270
22 463
Financial Statements
Return
1.1x
1.1x
5.4x
1.2x
2.4x
2.9x
1.3x
0.4x
1.4x
1.0x
0.8x
0.8x
0.8x
0.1x
0.1x
0.1x
1.3x
1.6x
Value
Q1 2023
1 690
451
385
3 309
518
1 965
8 318
1 431
289
583
2 303
529
2 583
3 112
859
859
4
31 550
29 920
Other
Value
Q4 2022
1 662
445
376
3 352
521
1964
8 320
1 438
268
832
2 538
614
2 351
2 965
1 005
1 005
12
31 632
28 782
Value
Q2 2022
2061
373
4 502
512
1 923
9 371
1 415
522
525
2462
1 540
1 540
1226
348
1 574
50
32 316
29 302
8View entire presentation