DigitalOcean Results Presentation Deck
→ Financial
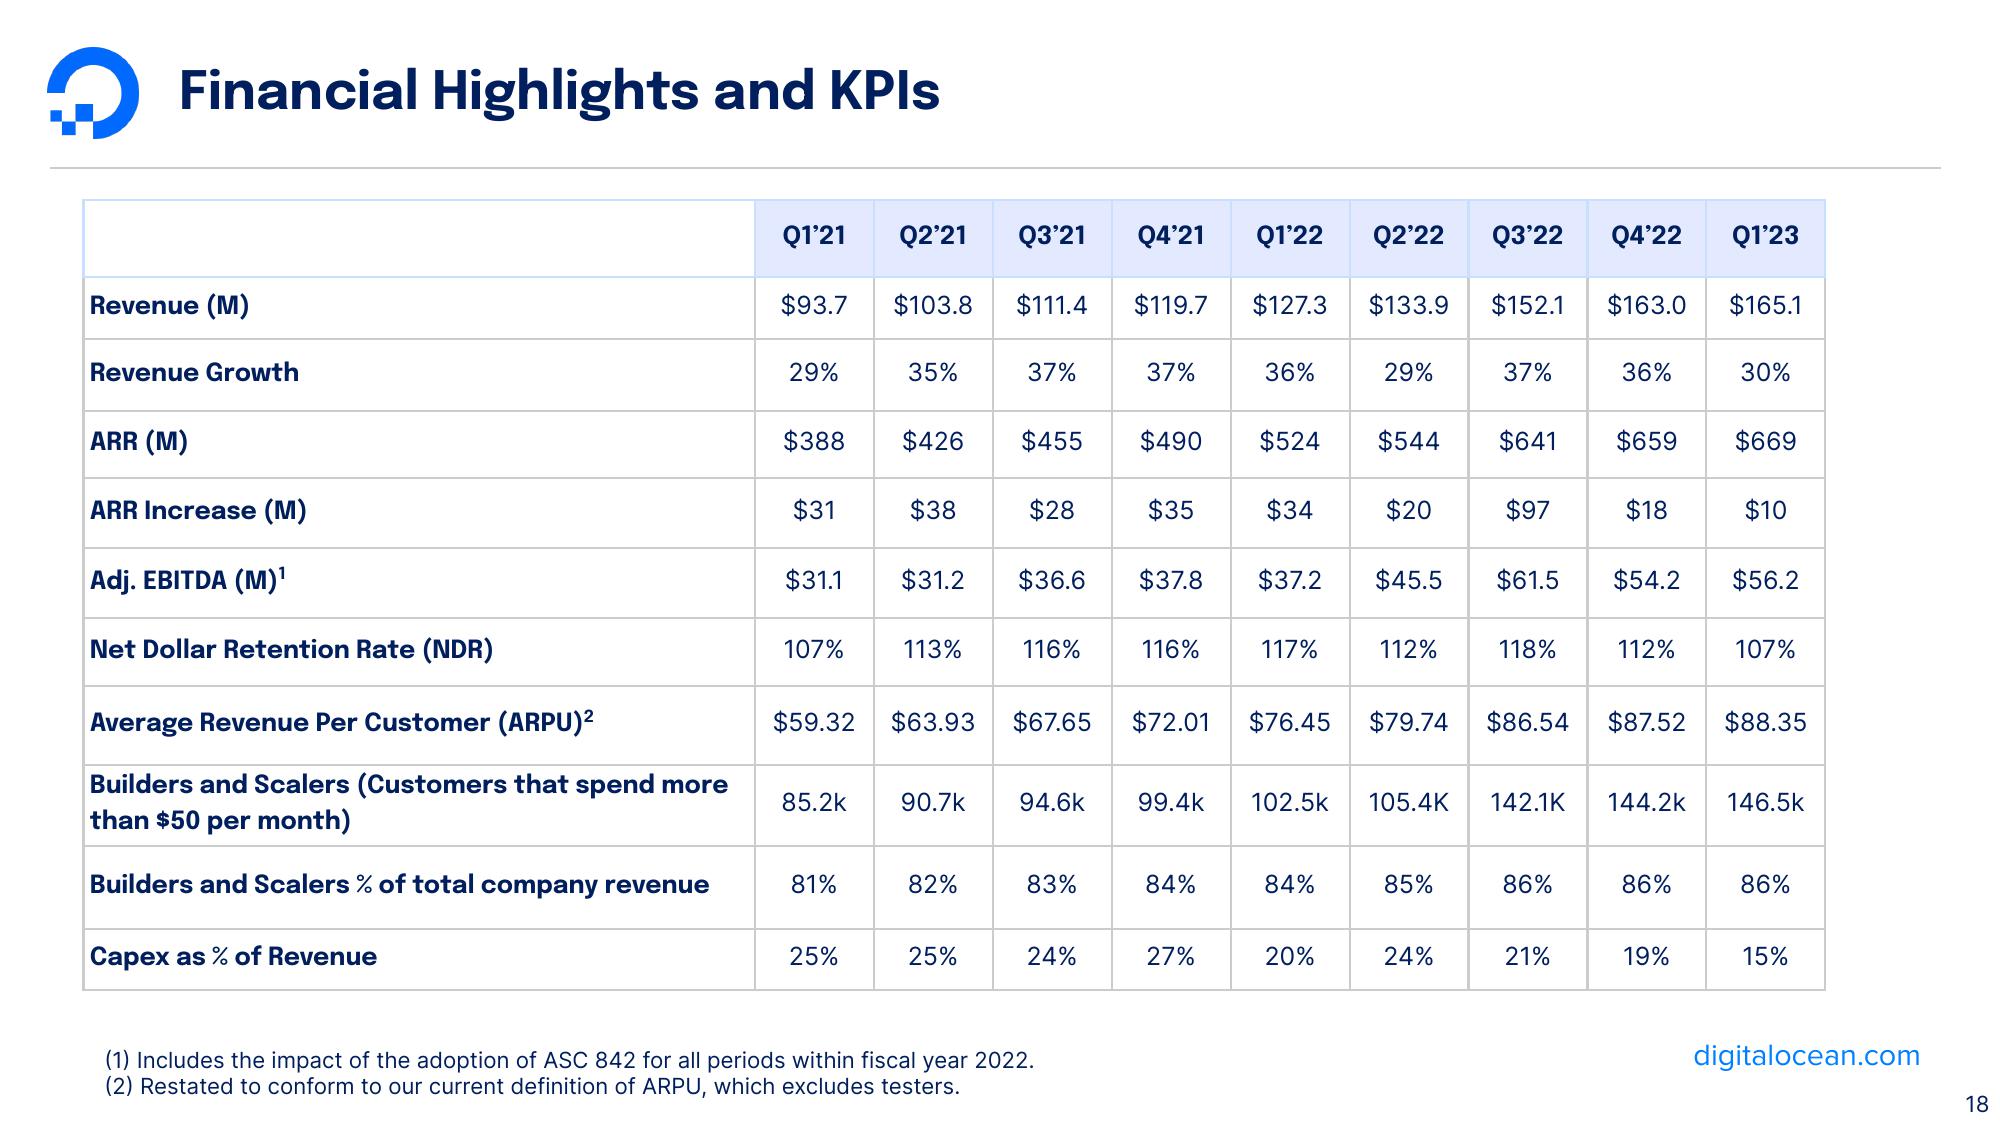
Financial Highlights and KPIs
Revenue (M)
Revenue Growth
ARR (M)
ARR Increase (M)
Adj. EBITDA (M)¹
Net Dollar Retention Rate (NDR)
Average Revenue Per Customer (ARPU)²
Builders and Scalers (Customers that spend more
than $50 per month)
Builders and Scalers % of total company revenue
Capex as % of Revenue
Q1'21
$93.7 $103.8
29%
$388
$31
$31.1
107%
$59.32
Q2'21 Q3'21 Q4'21
81%
25%
35%
$426
$38
113%
$111.4
37%
$31.2 $36.6
82%
$455
25%
$28
85.2k 90.7k 94.6k
$63.93 $67.65
116%
83%
24%
(1) Includes the impact of the adoption of ASC 842 for all periods within fiscal year 2022.
(2) Restated to conform to our current definition of ARPU, which excludes testers.
$119.7
37%
$35
$490 $524
$37.8
116%
$72.01
99.4k
84%
Q1'22
$127.3 $133.9 $152.1
27%
36%
$34
$37.2
117%
$76.45
102.5k
84%
20%
Q2'22 Q3'22 Q4'22
29%
$544
$20
$45.5
112%
$79.74
105.4K
85%
24%
37%
$641
$97
118%
$86.54
142.1K
$61.5 $54.2
86%
$163.0
21%
36%
$659
$18
112%
$87.52
144.2k
86%
19%
Q1'23
$165.1
30%
$669
$10
$56.2
107%
$88.35
146.5k
86%
15%
digitalocean.com
18View entire presentation