BlackRock Results Presentation Deck
$4,699
1%
8%
8%
1% 4%
78%
$29 $(1) $(19)
BlackRock.
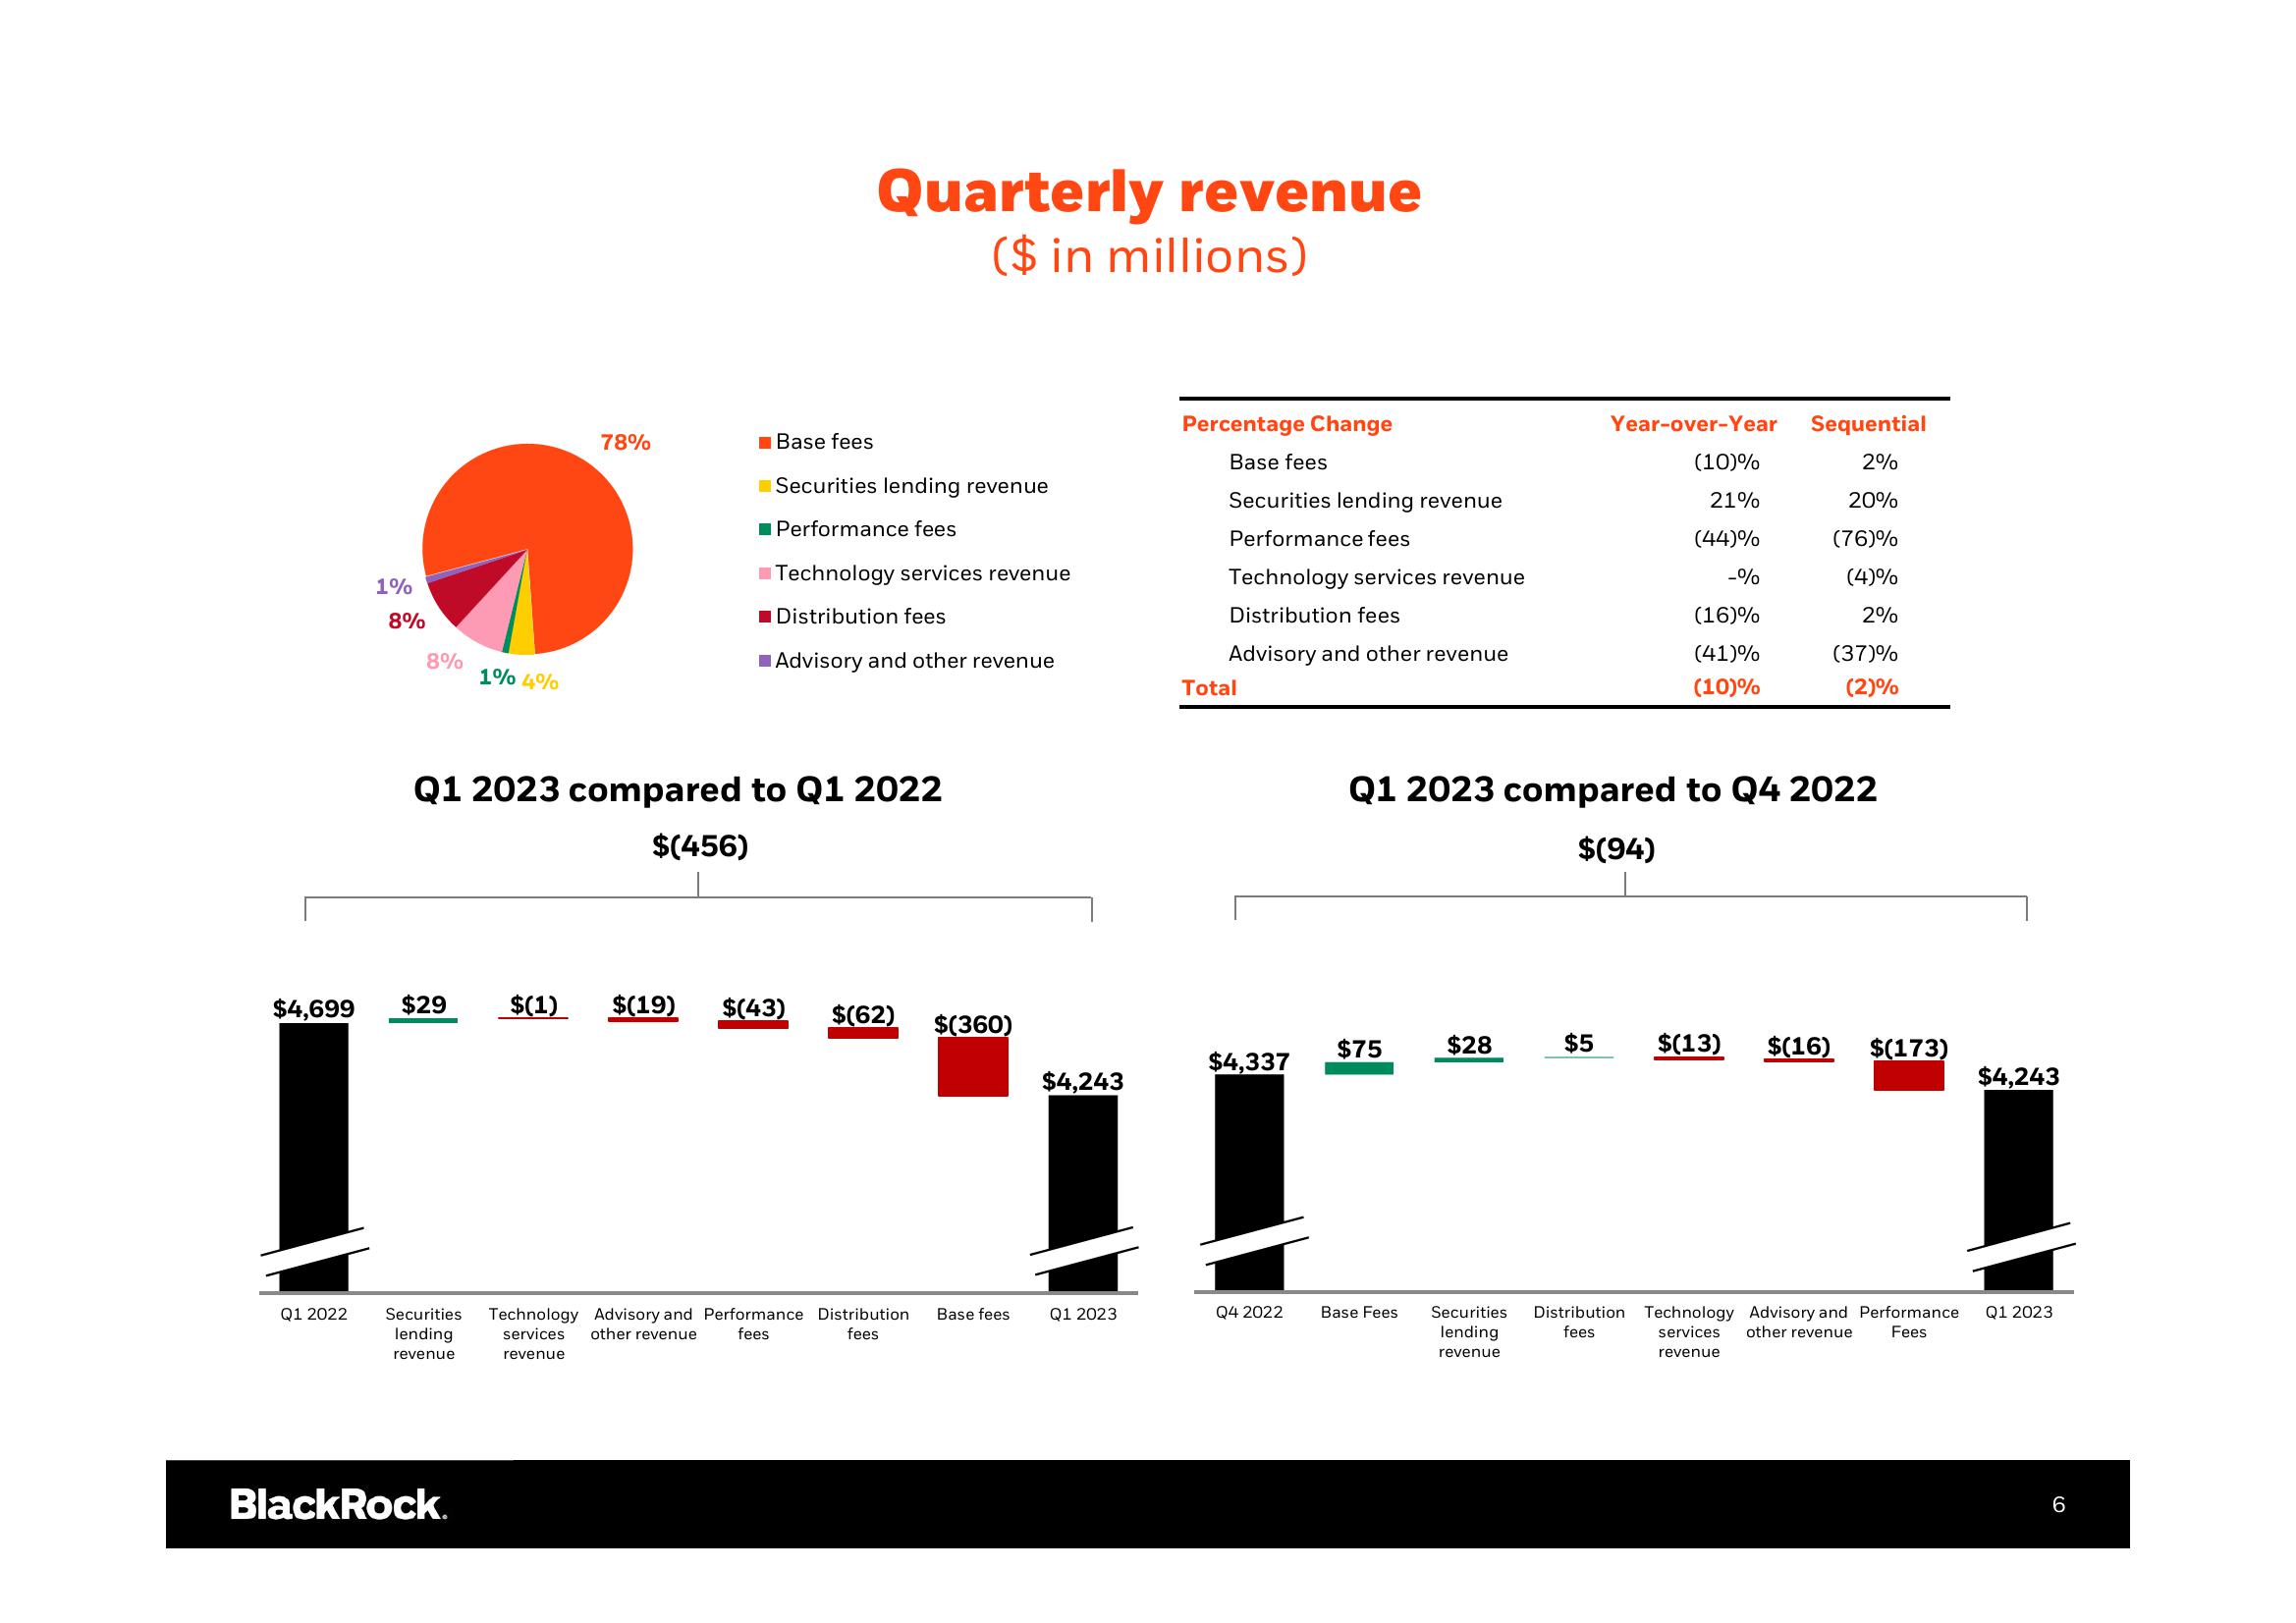
Quarterly revenue
($ in millions)
Base fees
Securities lending revenue
■ Performance fees
Q1 2023 compared to Q1 2022
$(456)
Technology services revenue
Distribution fees
Advisory and other revenue
$(43) $(62) $(360)
Q1 2022 Securities Technology Advisory and Performance Distribution Base fees
services other revenue fees
fees
revenue
lending
revenue
$4,243
Q1 2023
Percentage Change
Base fees
Securities lending revenue
Performance fees
Technology services revenue
Distribution fees
Advisory and other revenue
Total
$4,337
Q4 2022
$75
Base Fees
Q1 2023 compared to Q4 2022
$(94)
$28
Year-over-Year Sequential
(10)%
2%
21%
(44)%
20%
(76)%
(4)%
-%
2%
$5
(16)%
(41)%
(10)%
(37)%
(2)%
$(13) $(16) $(173)
$4,243
Securities Distribution Technology Advisory and Performance Q1 2023
lending
services other revenue Fees
fees
revenue
revenue
6View entire presentation