J.P.Morgan Results Presentation Deck
JPMORGAN CHASE & CO.
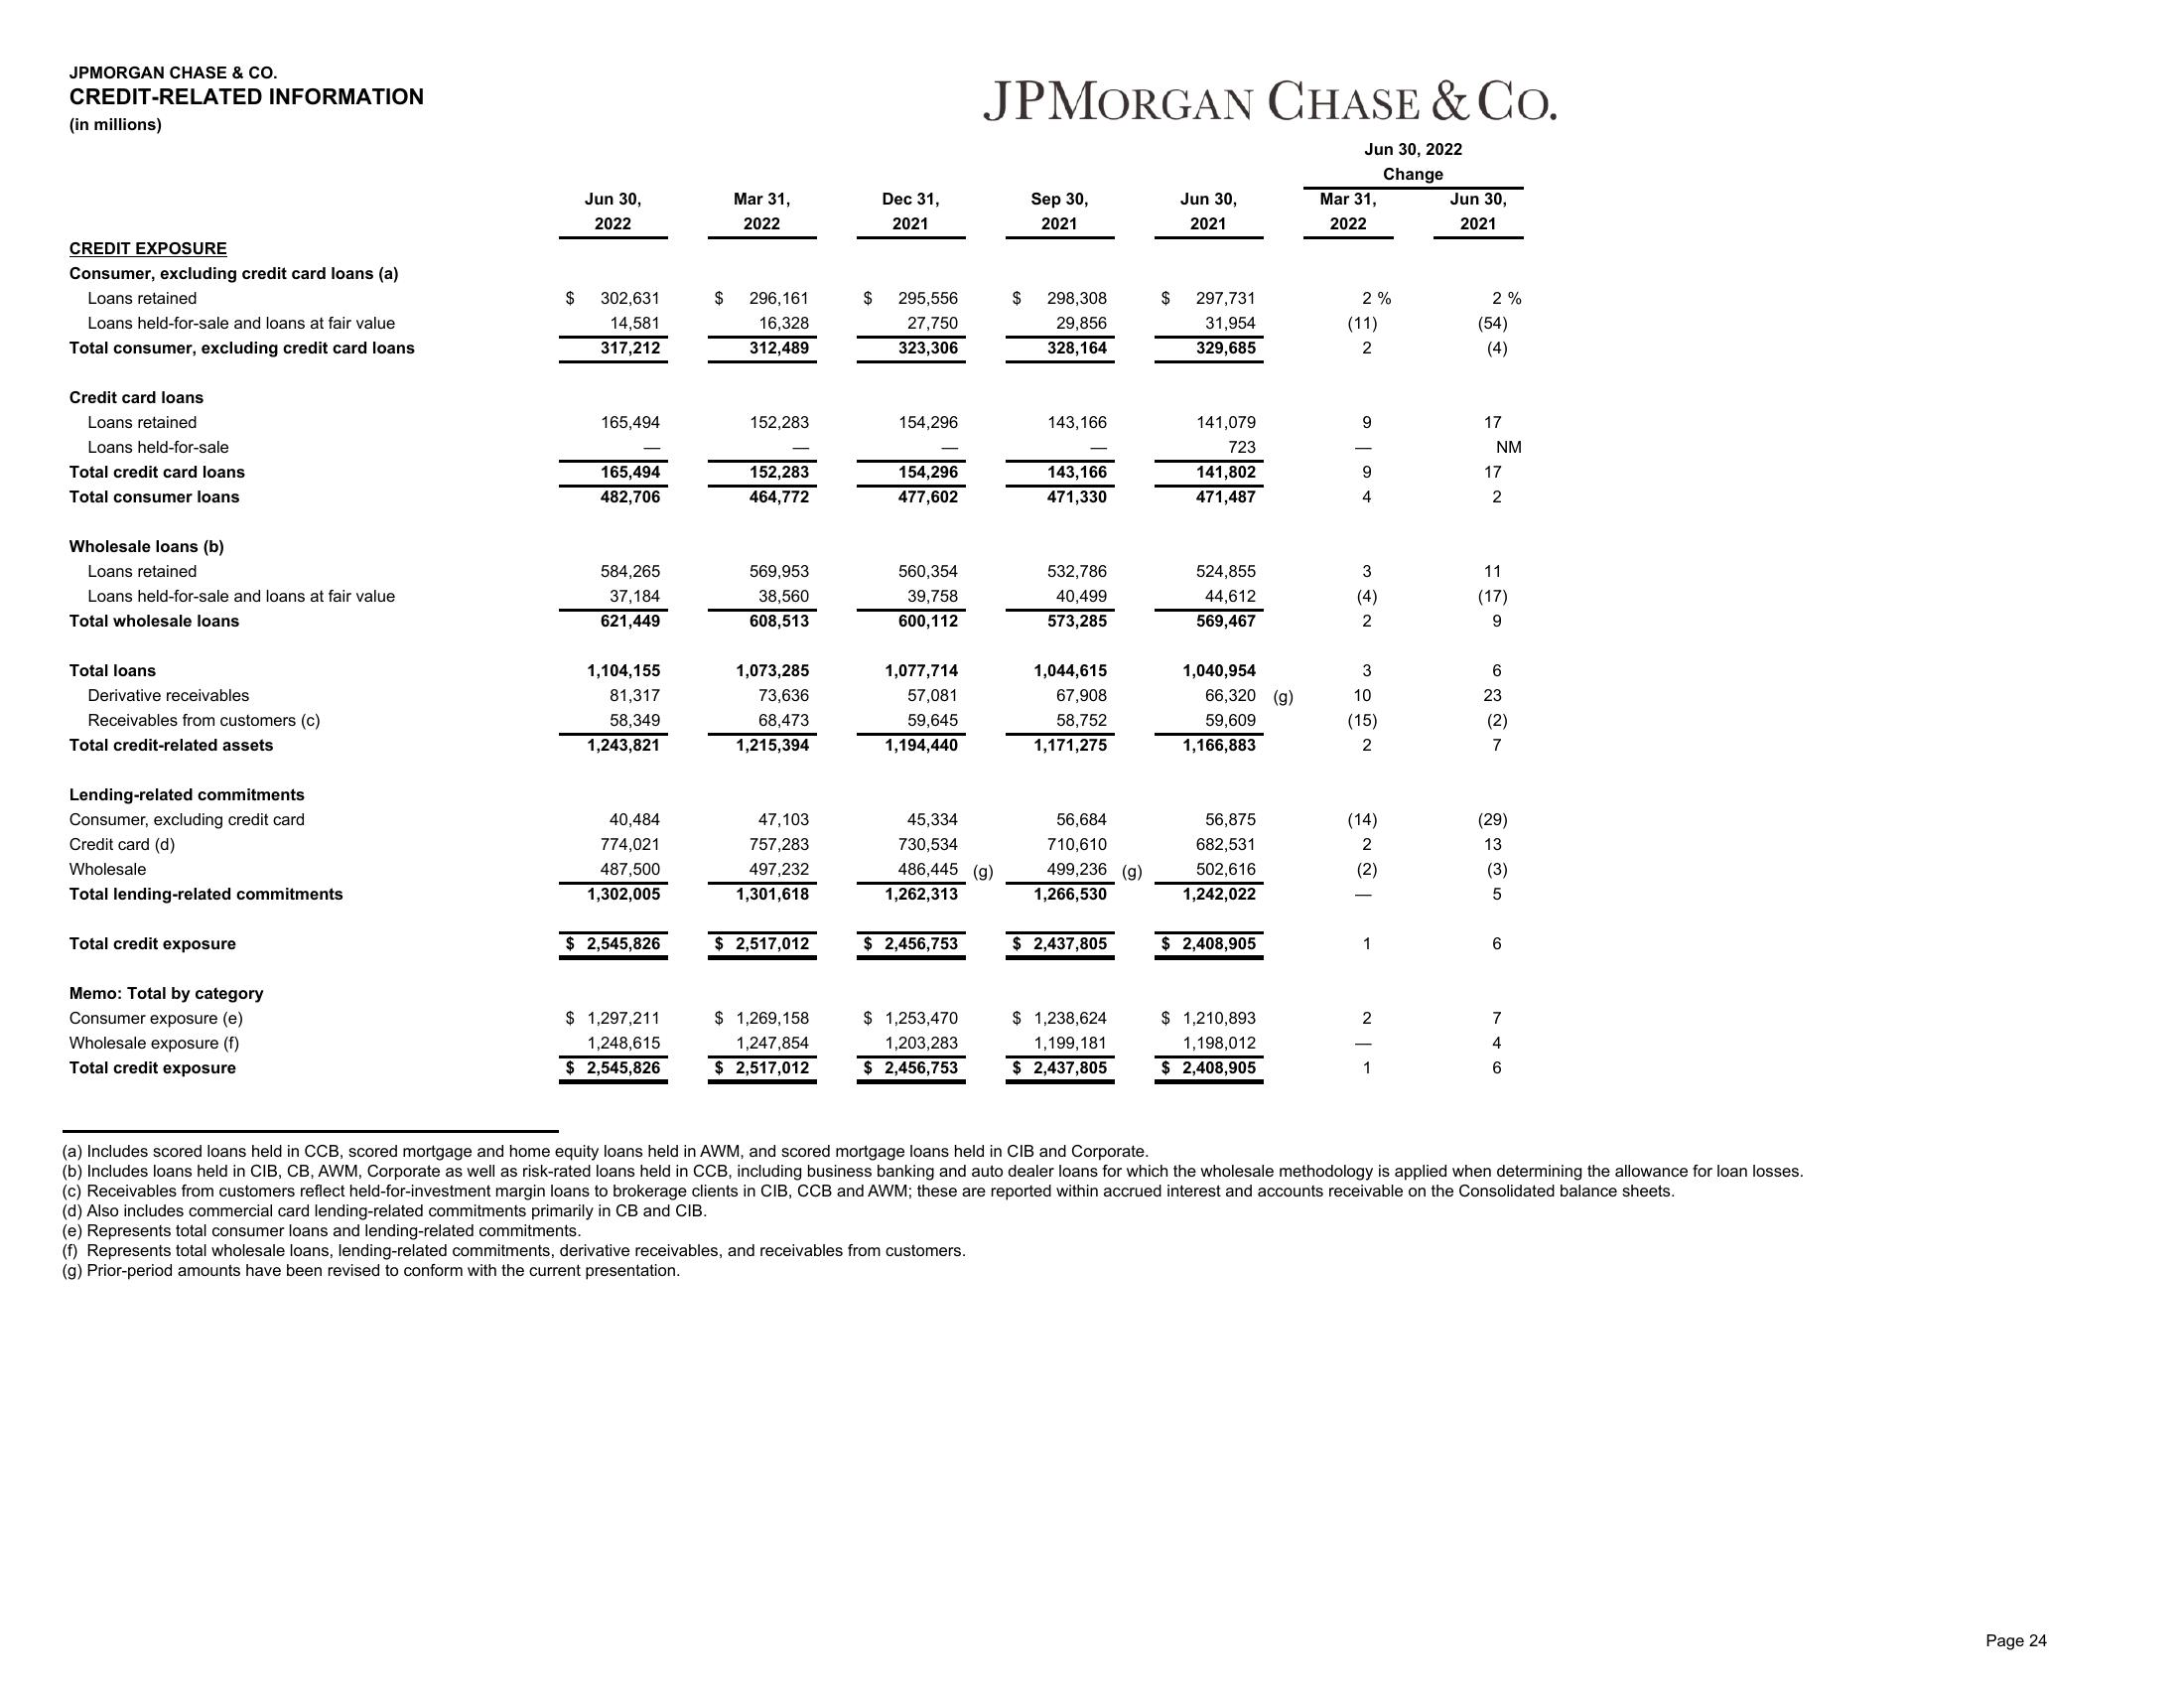
CREDIT-RELATED INFORMATION
(in millions)
CREDIT EXPOSURE
Consumer, excluding credit card loans (a)
Loans retained
Loans held-for-sale and loans at fair value
Total consumer, excluding credit card loans
Credit card loans
Loans retained
Loans held-for-sale
Total credit card loans
Total consumer loans
Wholesale loans (b)
Loans retained
Loans held-for-sale and loans at fair value
Total wholesale loans
Total loans
Derivative receivables
Receivables from customers (c)
Total credit-related assets
Lending-related commitments
Consumer, excluding credit card
Credit card (d)
Wholesale
Total lending-related commitments
Total credit exposure
Memo: Total by category
Consumer exposure (e)
Wholesale exposure (f)
Total credit exposure
$
Jun 30,
2022
302,631
14,581
317,212
165,494
165,494
482,706
584,265
37,184
621,449
1,104,155
81,317
58,349
1,243,821
40,484
774,021
487,500
1,302,005
$ 2,545,826
$ 1,297,211
1,248,615
$ 2,545,826
$
Mar 31,
2022
296,161
16,328
312,489
152,283
152,283
464,772
569,953
38,560
608,513
1,073,285
73,636
68,473
1,215,394
47,103
757,283
497,232
1,301,618
$ 2,517,012
$1,269,158
1,247,854
$ 2,517,012
Dec 31,
2021
$ 295,556
27,750
323,306
154,296
154,296
477,602
560,354
39,758
600,112
1,077,714
57,081
59,645
1,194,440
45,334
730,534
486,445 (g)
1,262,313
$ 2,456,753
$ 1,253,470
1,203,283
$ 2,456,753
JPMORGAN CHASE & CO.
Jun 30, 2022
Change
(e) Represents total consumer loans and lending-related commitments.
(f) Represents total wholesale loans, lending-related commitments, derivative receivables, and receivables from customers.
(g) Prior-period amounts have been revised to conform with the current presentation.
$
Sep 30,
2021
298,308
29,856
328,164
143,166
143,166
471,330
532,786
40,499
573,285
1,044,615
67,908
58,752
1,171,275
56,684
710,610
499,236
1,266,530
$ 2,437,805
$ 1,238,624
1,199,181
$ 2,437,805
(g)
$
Jun 30,
2021
297,731
31,954
329,685
141,079
723
141,802
471,487
524,855
44,612
569,467
1,040,954
66,320 (g)
59,609
1,166,883
56,875
682,531
502,616
1,242,022
$ 2,408,905
$1,210,893
1,198,012
$ 2,408,905
Mar 31,
2022
2%
(11)
2
9
9
4
3
(4)
2
3
10
(15)
2
(14)
2
(2)
1
2
1
Jun 30,
2021
2%
(54)
17
NM
17
2
11
(17)
9
6
23
(2)
7
(29)
13
(3)
5
6
7
4
6
(a) Includes scored loans held in CCB, scored mortgage and home equity loans held in AWM, and scored mortgage loans held in CIB and Corporate.
(b) Includes loans held in CIB, CB, AWM, Corporate as well as risk-rated loans held in CCB, including business banking and auto dealer loans for which the wholesale methodology is applied when determining the allowance for loan losses.
(c) Receivables from customers reflect held-for-investment margin loans to brokerage clients in CIB, CCB and AWM; these are reported within accrued interest and accounts receivable on the Consolidated balance sheets.
(d) Also includes commercial card lending-related commitments primarily in CB and CIB.
Page 24View entire presentation