Uber Shareholder Engagement Presentation Deck
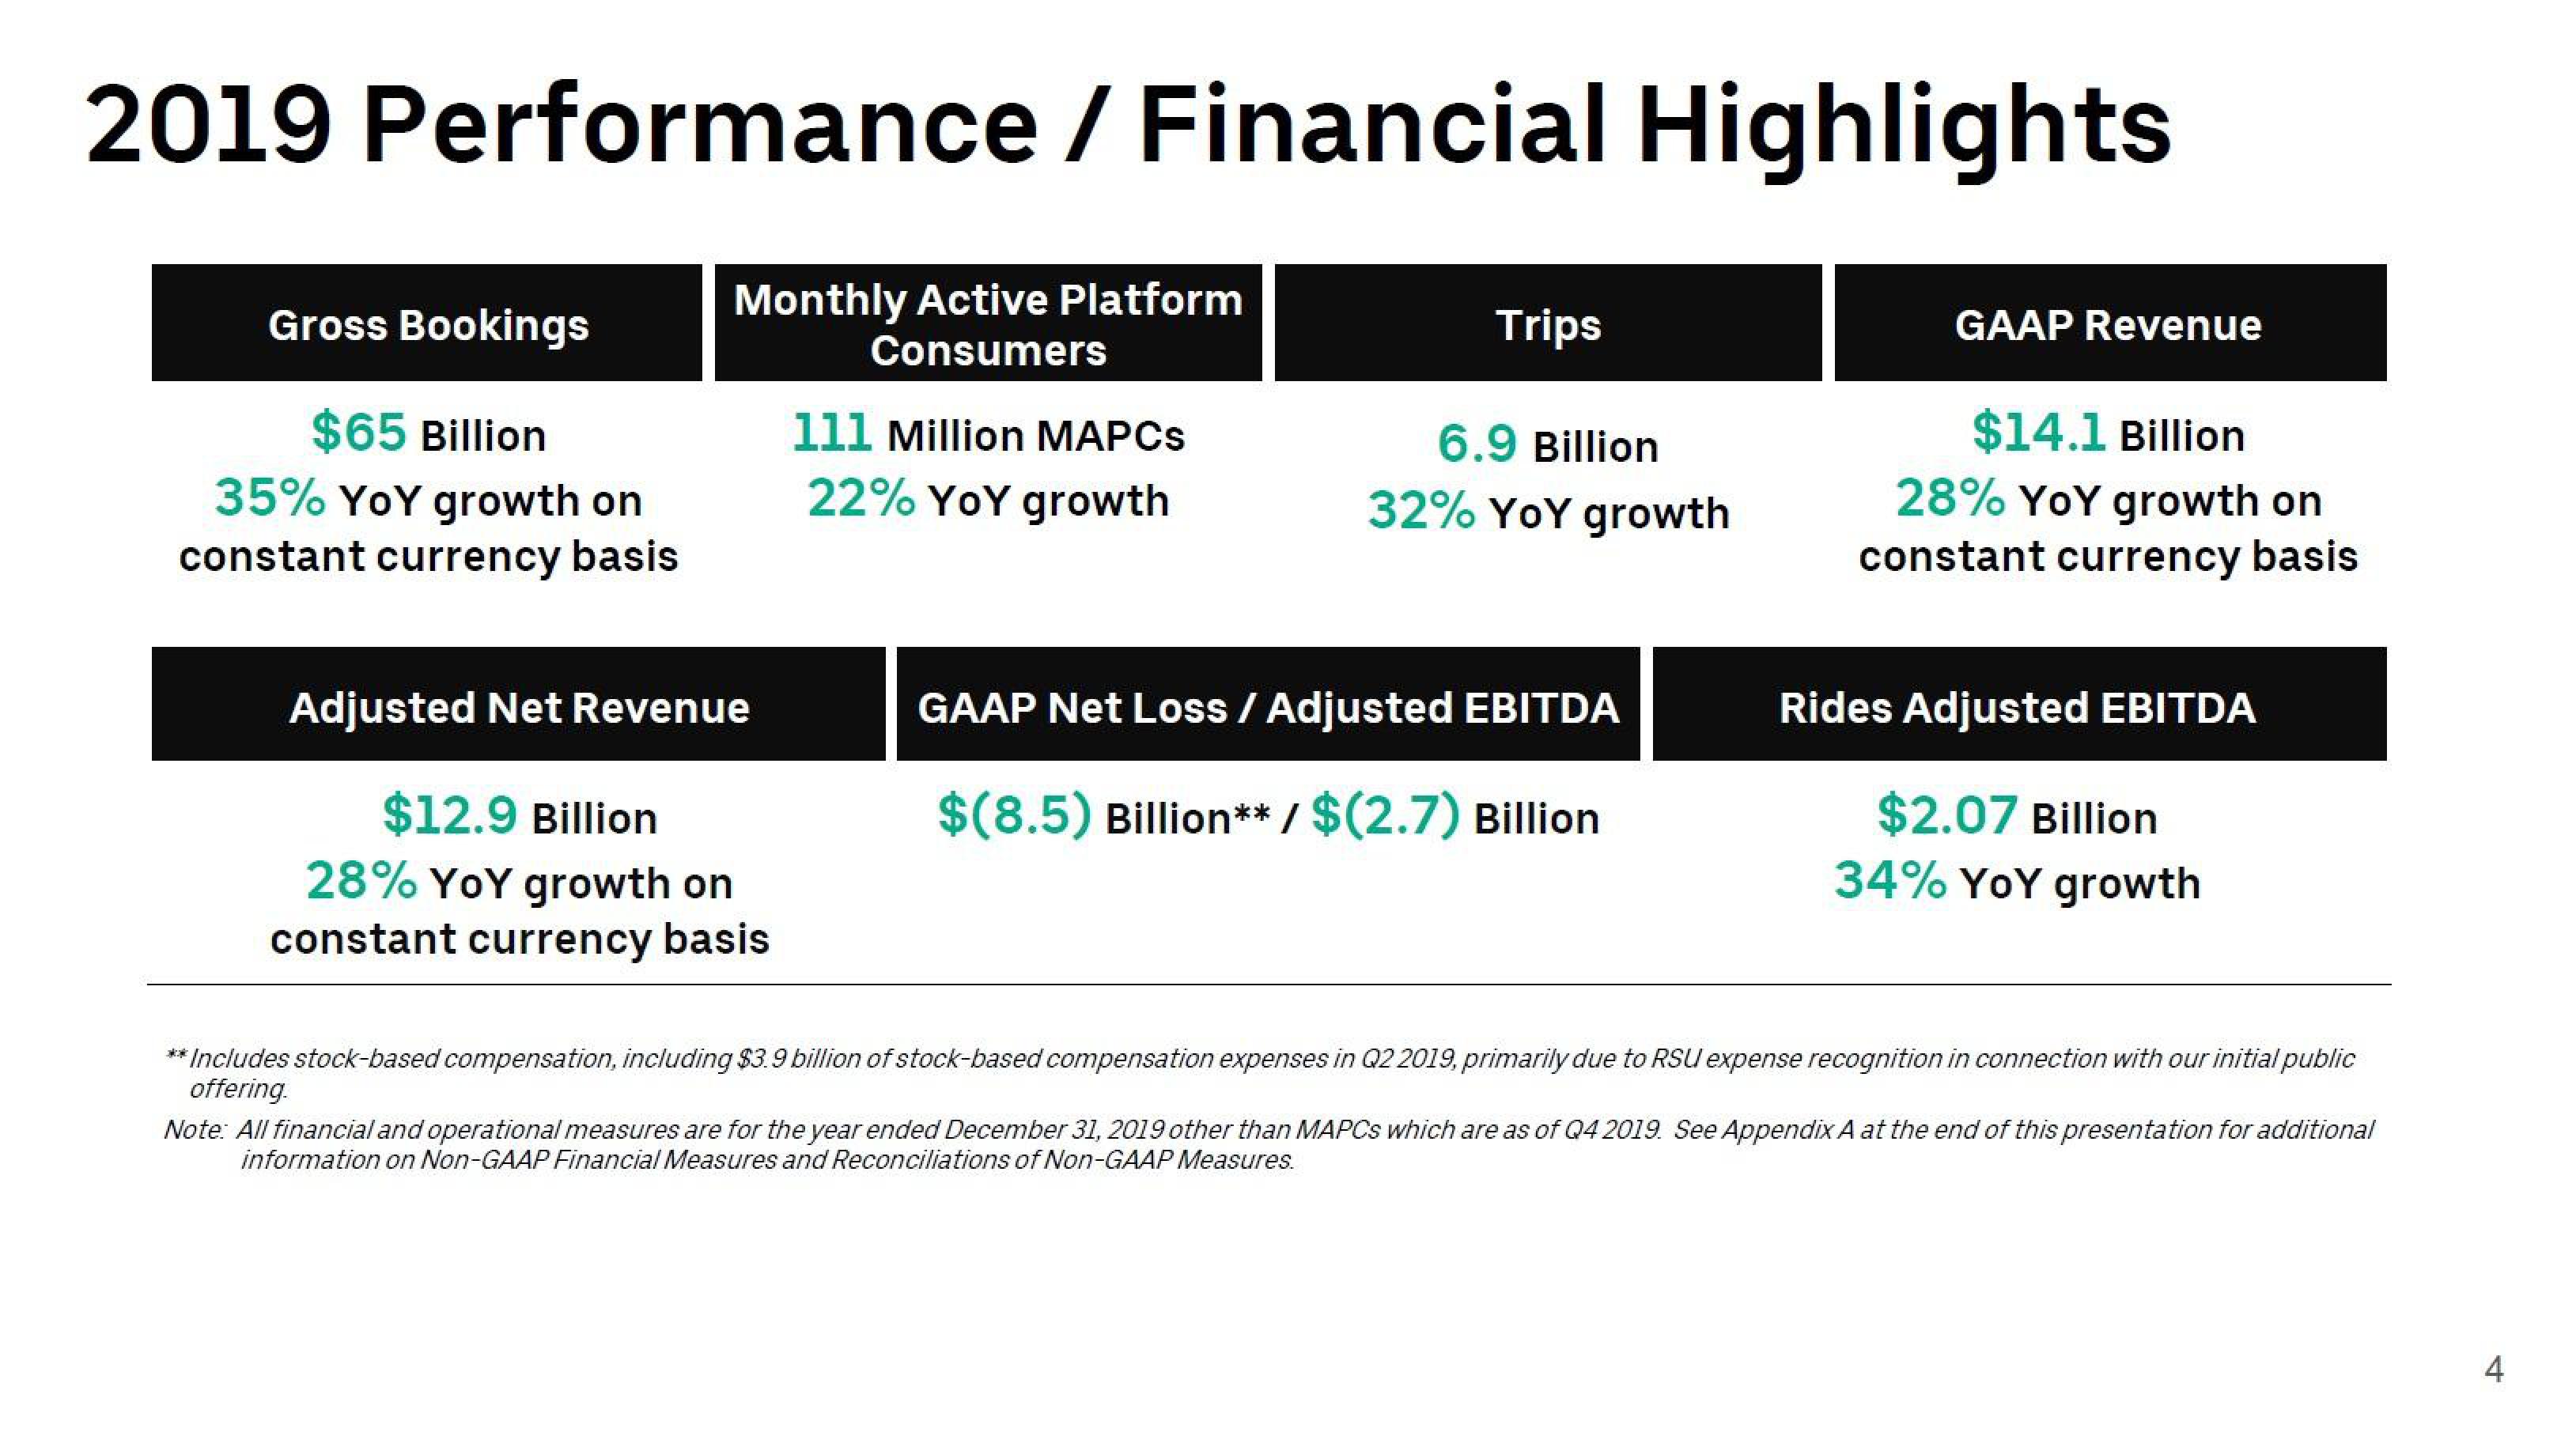
2019 Performance / Financial Highlights
Monthly Active Platform
Consumers
Gross Bookings
$65 Billion
35% YoY growth on
constant currency basis
Adjusted Net Revenue
$12.9 Billion
28% YoY growth on
constant currency basis
111 Million MAPCs
22% YoY growth
Trips
6.9 Billion
32% YoY growth
GAAP Net Loss / Adjusted EBITDA
$(8.5) Billion**/ $(2.7) Billion
GAAP Revenue
$14.1 Billion
28% YoY growth on
constant currency basis
Rides Adjusted EBITDA
$2.07 Billion
34% YoY growth
*Includes stock-based compensation, including $3.9 billion of stock-based compensation expenses in Q2 2019, primarily due to RSU expense recognition in connection with our initial public
offering.
Note: All financial and operational measures are for the year ended December 31, 2019 other than MAPCs which are as of Q4 2019. See Appendix A at the end of this presentation for additional
information on Non-GAAP Financial Measures and Reconciliations of Non-GAAP Measures.
4View entire presentation