Affirm Results Presentation Deck
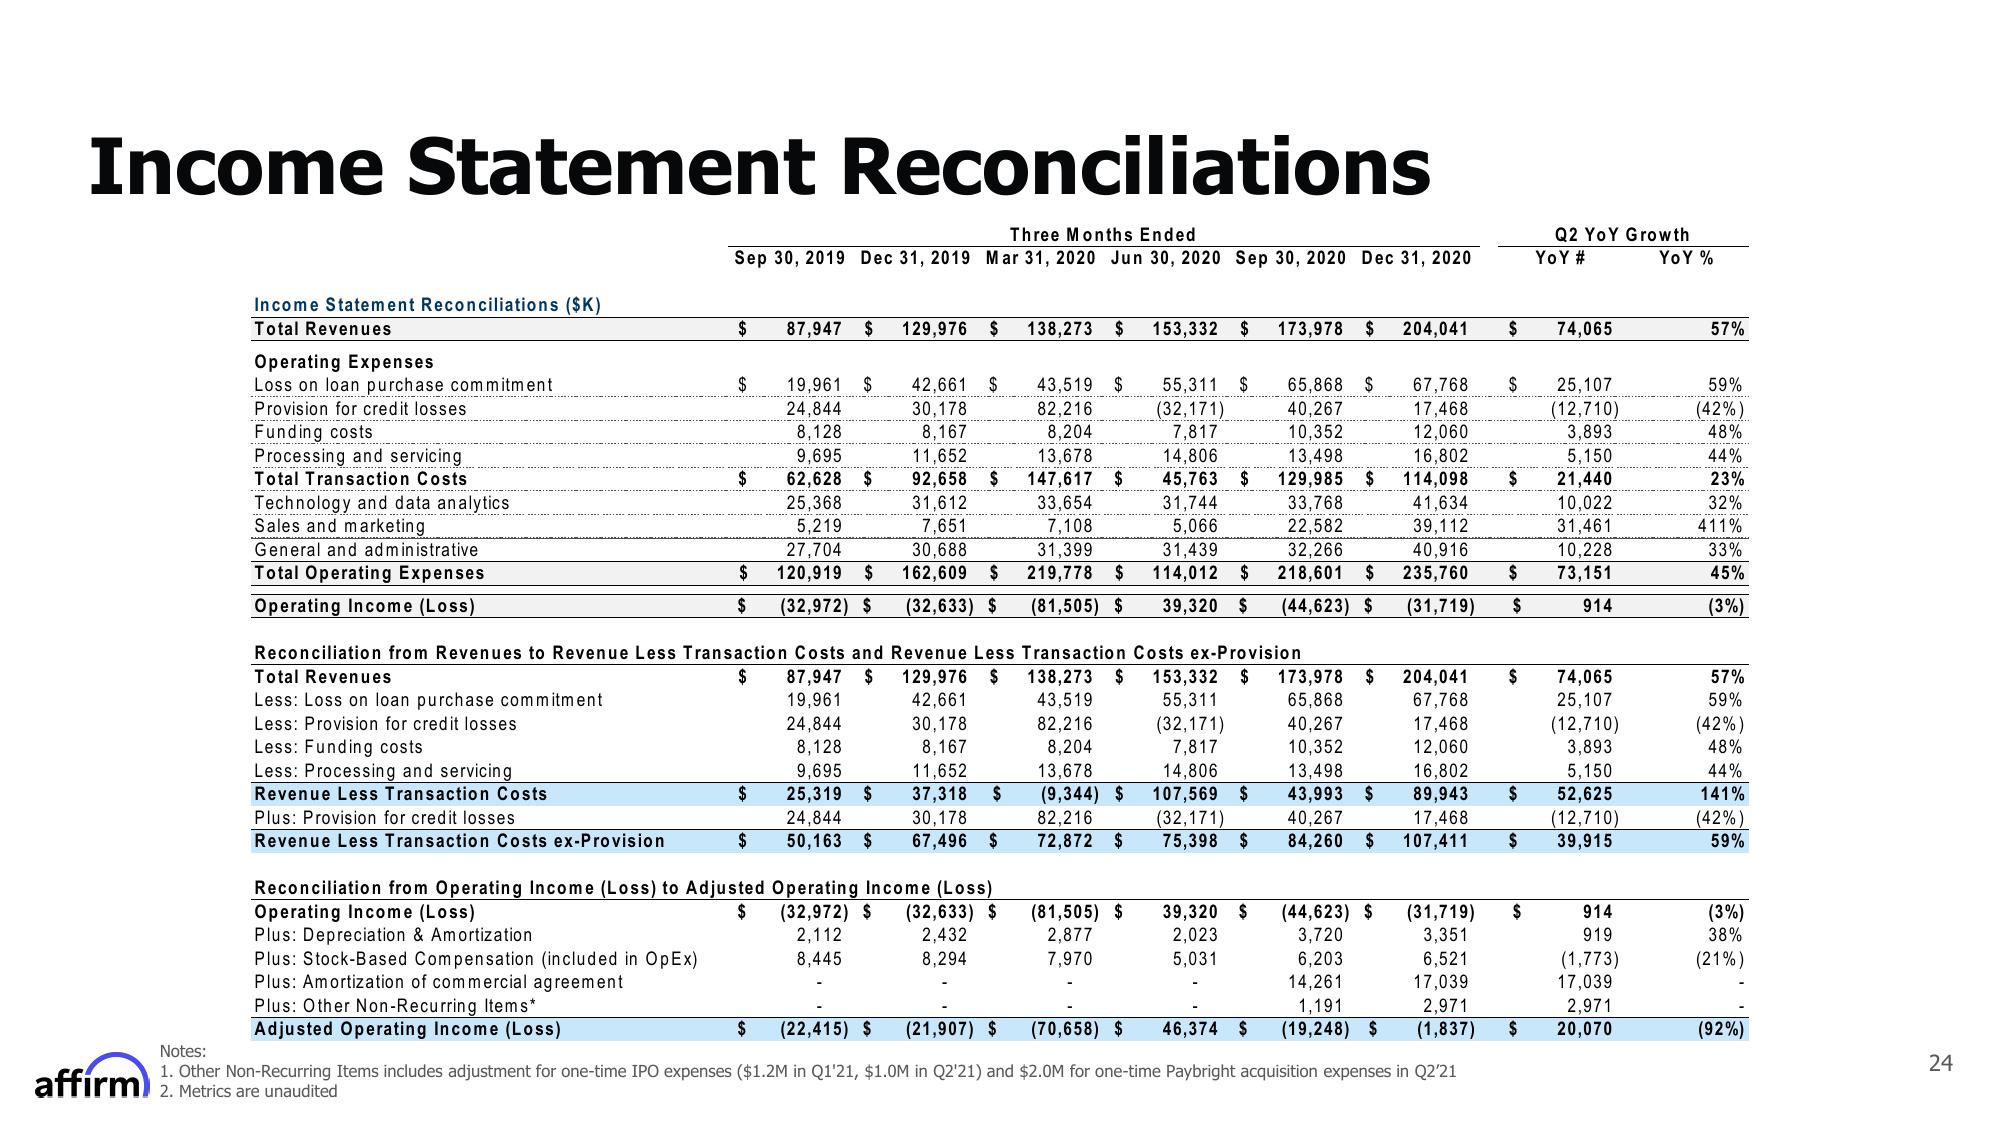
Income Statement Reconciliations
Income Statement Reconciliations ($K)
Total Revenues
Operating Expenses
Loss on loan purchase commitment
Provision for credit losses
Funding costs
Processing and servicing
Total Transaction Costs
Technology and data analytics
Sales and marketing
General and administrative
Total Operating Expenses
Operating Income (Loss)
Less: Funding costs
Less: Processing and servicing
Revenue Less Transaction Costs
Plus: Provision for credit losses
Revenue Less Transaction Costs ex-Provision
Three Months Ended
Sep 30, 2019 Dec 31, 2019 Mar 31, 2020 Jun 30, 2020 Sep 30, 2020 Dec 31, 2020
$
Plus: Depreciation & Amortization
Plus: Stock-Based Compensation (included in OpEx)
Plus: Amortization of commercial agreement
Plus: Other Non-Recurring Items*
Adjusted Operating Income (Loss)
$
$
$
87,947 $ 129,976
Reconciliation from Revenues to Revenue Less Transaction Costs and
Total Revenues
87,947 $
19,961
$
Less: Loss on loan purchase commitment
Less: Provision for credit losses
24,844
$
19,961 $ 42,661
24,844
30,178
8,128
8,167
9,695
11,652
13,678
62,628
92,658 $ 147,617 $
25,368
31,612
5,219
7,651
30,688
162,609 $
(32,633) $
27,704
120,919 $
(32,972) $
8,128
9,695
25,319 $
24,844
$ 50,163 $
$ 138,273 $
11,652
37,318 $
30,178
67,496 $
Reconciliation from Operating Income (Loss) to Adjusted Operating Income (Loss)
Operating Income (Loss)
$
(32,972) $ (32,633) $
2,112
2,432
8,445
8,294
43,519 $
82,216
8,204
33,654
7,108
31,399
219,778 $
(81,505) $
153,332 $
(81,505) $
2,877
7,970
Revenue Less Transaction Costs ex-Provision
129,976 $ 138,273 $
42,661
43,519
30,178
82,216
8,167
8,204
13,678
(9,344) $
82,216
72,872 $
55,311 $
(32,171)
7,817
65,868 $
40,267
10,352
13,498
14,806
45,763
31,744
129,985 $
33,768
5,066
22,582
31,439
32.266
114,012 $ 218,601 $
39,320 $
(44,623) $
$
173,978 $
(32,171)
7,817
14,806
107,569 $
(32,171)
75,398 $
39,320 $
2,023
5,031
(44,623) $
3,720
204,041
6,203
14,261
1,191
(19,248) $
67,768
17,468
12,060
153,332 $ 173,978 $
55,311
65,868
40,267
10,352
13,498
43,993 $
40,267
16,802
89,943 $
17,468
84,260 $ 107,411
$
$
25,107
(12,710)
3,893
5,150
16,802
114,098
21,440
41,634
10,022
39,112
40,916
235,760 $ 73,151
31,461
10,228
(31,719)
$
914
204,041 $
67,768
17,468
12,060
6,521
17,039
2,971
(1,837)
$ (22,415) $ (21,907) $ (70,658) $ 46,374 $
Notes:
1. Other Non-Recurring Items includes adjustment for one-time IPO expenses ($1.2M in Q1'21, $1.0M in Q2'21) and $2.0M for one-time Paybright acquisition expenses in Q2'21
affirm) 2. Metrics are unaudited
(31,719) $
3,351
$
Q2 YOY Growth
YOY #
YOY %
74,065
74,065
25,107
(12,710)
3,893
5,150
52,625
(12,710)
39,915
914
919
(1,773)
17,039
2,971
$ 20,070
57%
59%
(42%)
48%
44%
23%
32%
411%
33%
45%
(3%)
57%
59%
(42%)
48%
44%
141%
(42%)
59%
(3%)
38%
(21%)
(92%)
24View entire presentation