Nikola Results Presentation Deck
NIKOLA.
PAGE/1 1
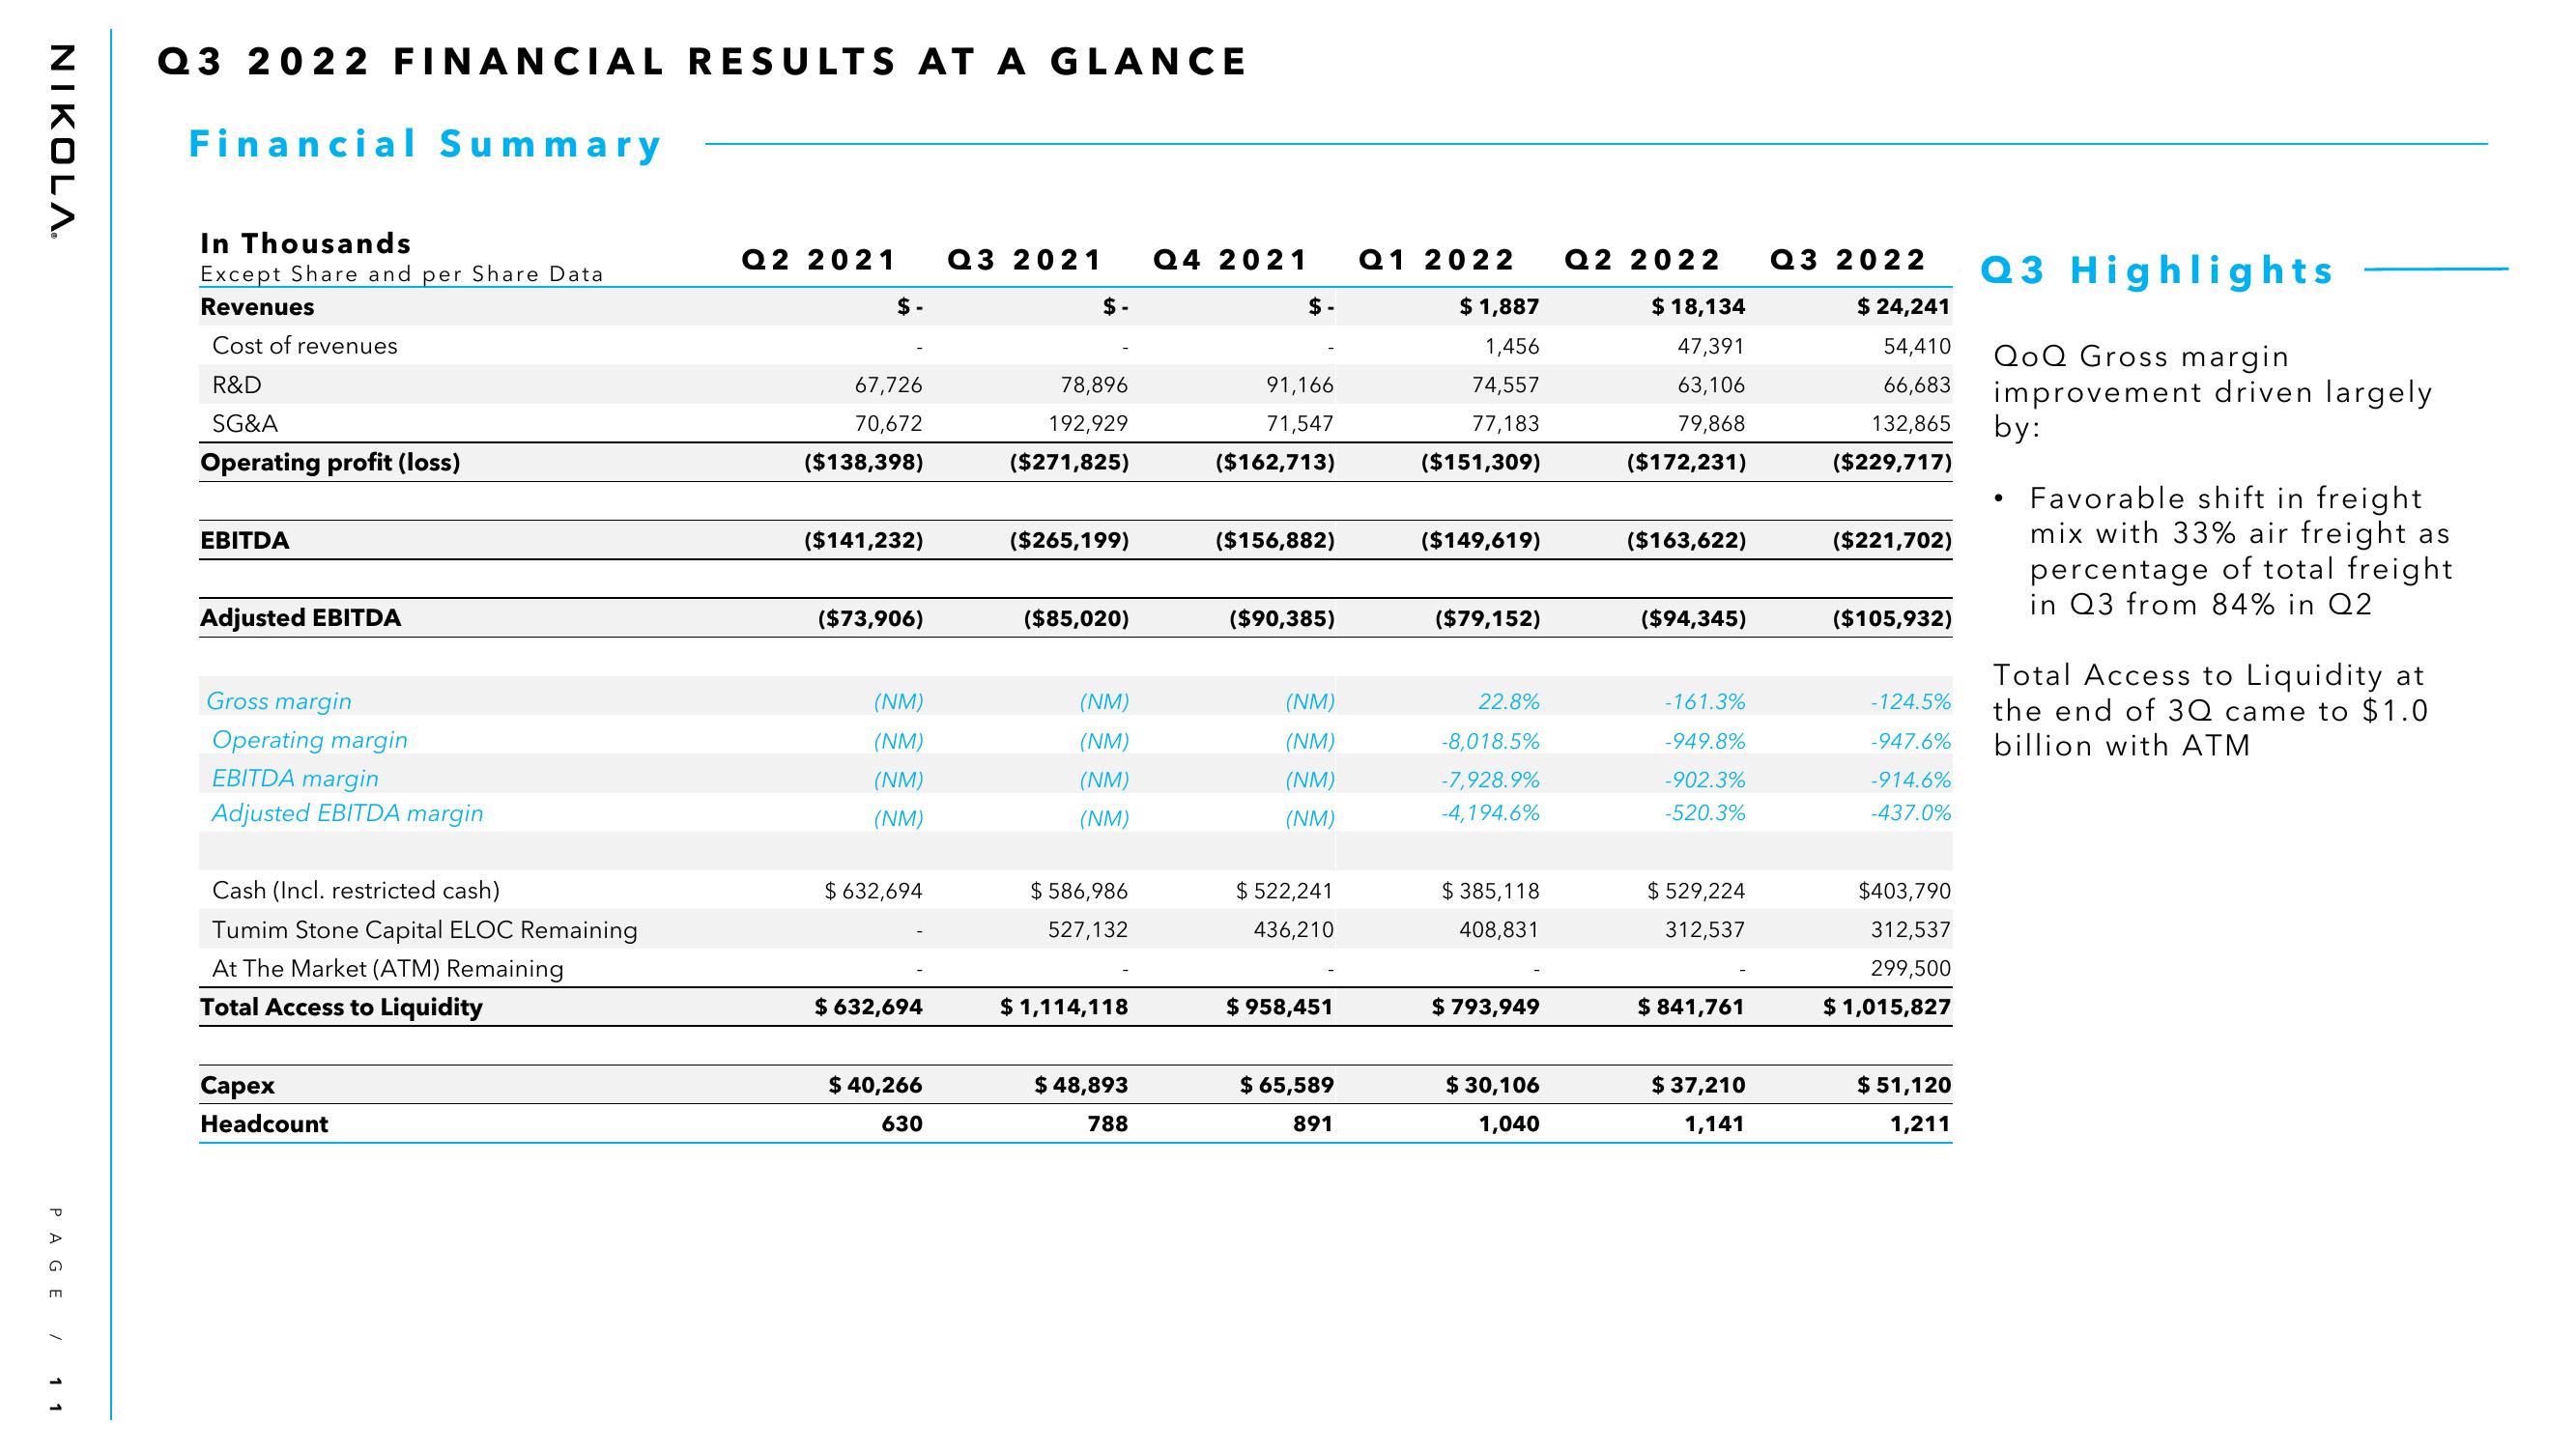
Q3 2022 FINANCIAL RESULTS AT A GLANCE
Financial Summary
In Thousands
Except Share and per Share Data
Revenues
Cost of revenues
R&D
SG&A
Operating profit (loss)
EBITDA
Adjusted EBITDA
Gross margin
Operating margin
EBITDA margin
Adjusted EBITDA margin
Cash (Incl. restricted cash)
Tumim Stone Capital ELOC Remaining
At The Market (ATM) Remaining
Total Access to Liquidity
Capex
Headcount
Q2 2021 Q3 2021 Q4 2021
$-
67,726
70,672
($138,398)
($141,232)
($73,906)
(NM)
(NM)
(NM)
(NM)
$632,694
$ 632,694
$ 40,266
630
$-
78,896
192,929
($271,825)
($265,199)
($85,020)
(NM)
(NM)
(NM)
(NM)
$ 586,986
527,132
$1,114,118
$ 48,893
788
$-
91,166
71,547
($162,713)
($156,882)
($90,385)
(NM)
(NM)
(NM)
(NM)
$ 522,241
436,210
$ 958,451
$ 65,589
891
Q1 2022 Q2 2022
$ 18,134
47,391
$ 1,887
1,456
74,557
77,183
($151,309)
63,106
79,868
($172,231)
($149,619)
($79,152)
22.8%
-8,018.5%
-7,928.9%
-4,194.6%
$385,118
408,831
$ 793,949
$ 30,106
1,040
($163,622)
($94,345)
-161.3%
-949.8%
-902.3%
-520.3%
$529,224
312,537
$ 841,761
$ 37,210
1,141
Q3 2022
$ 24,241
54,410
66,683
132,865
($229,717)
($221,702)
($105,932)
-124.5%
-947.6%
-914.6%
-437.0%
$403,790
312,537
299,500
$ 1,015,827
$ 51,120
1,211
Q3 Highlights
QoQ Gross margin
improvement driven largely
by:
●
Favorable shift in freight
mix with 33% air freight as
percentage of total freight
in Q3 from 84% in Q2
Total Access to Liquidity at
the end of 3Q came to $1.0
billion with ATMView entire presentation