Micro Focus Credit Presentation Deck
18
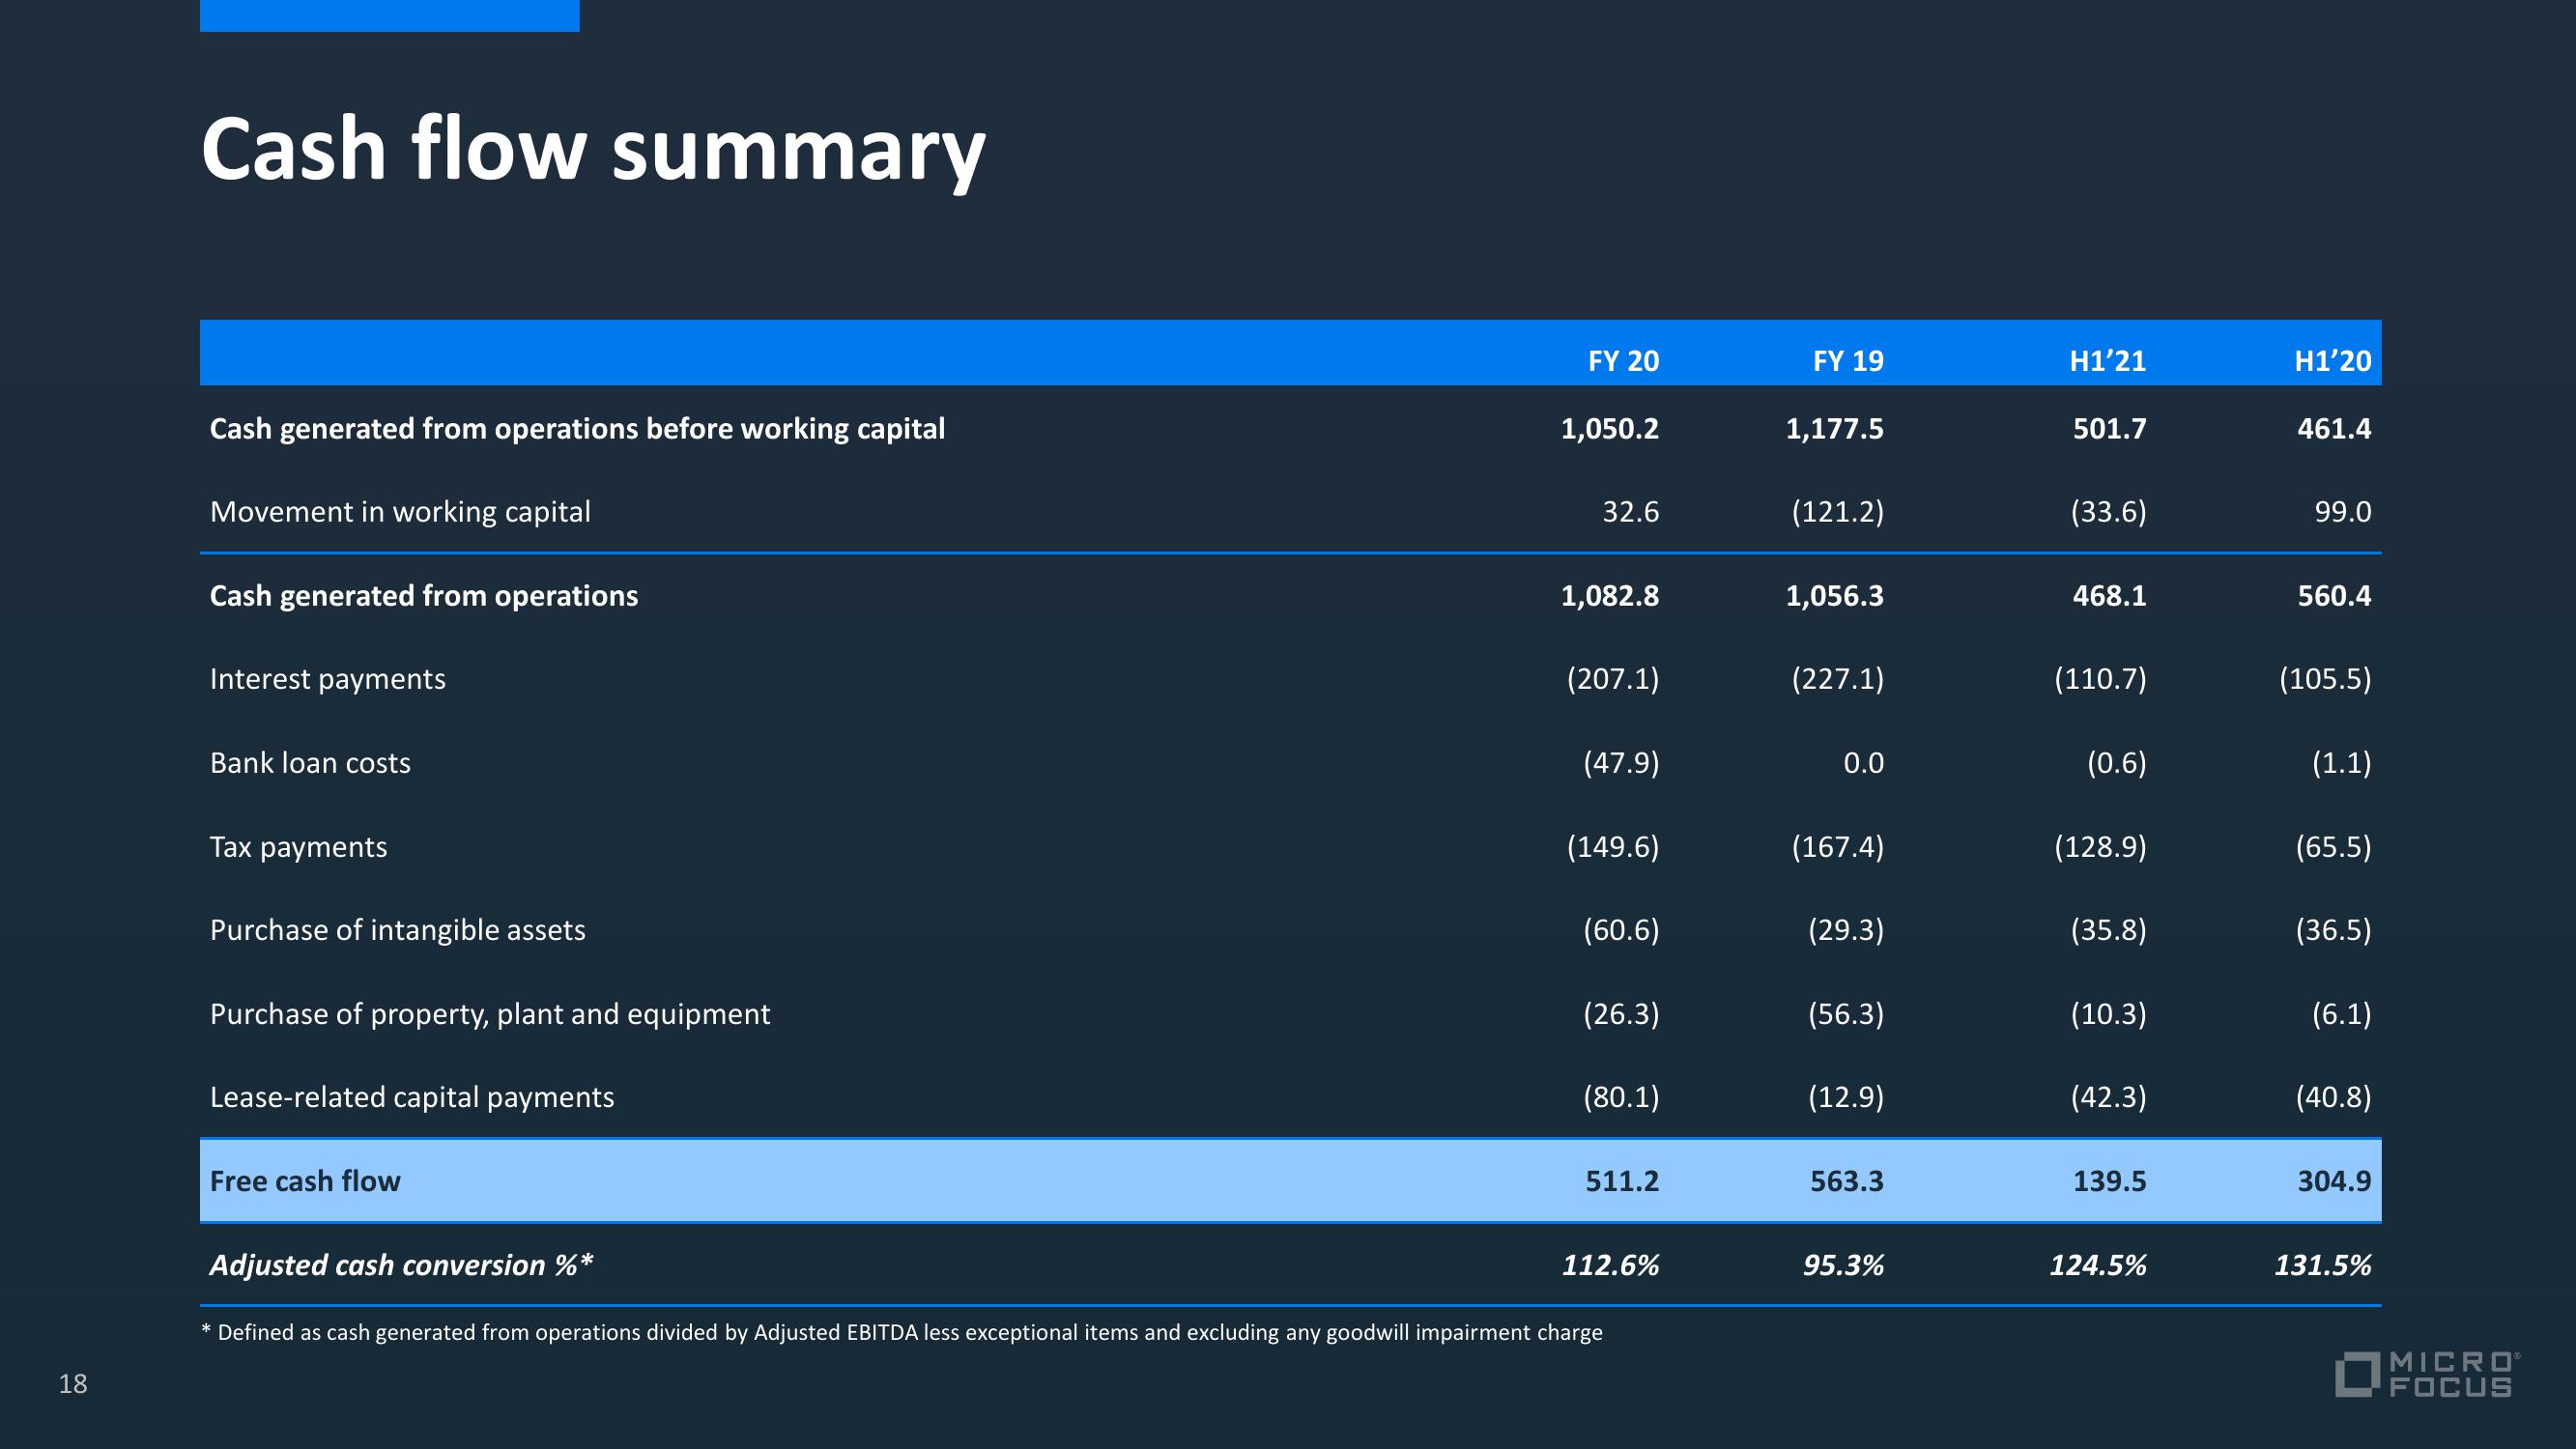
Cash flow summary
Cash generated from operations before working capital
Movement in working capital
Cash generated from operations
Interest payments
Bank loan costs
Tax payments
Purchase of intangible assets
Purchase of property, plant and equipment
Lease-related capital payments
Free cash flow
Adjusted cash conversion %*
FY 20
1,050.2
32.6
1,082.8
(207.1)
(47.9)
(149.6)
(60.6)
(26.3)
(80.1)
511.2
112.6%
* Defined as cash generated from operations divided by Adjusted EBITDA less exceptional items and excluding any goodwill impairment charge
FY 19
1,177.5
(121.2)
1,056.3
(227.1)
0.0
(167.4)
(29.3)
(56.3)
(12.9)
563.3
95.3%
H1’21
501.7
(33.6)
468.1
(110.7)
(0.6)
(128.9)
(35.8)
(10.3)
(42.3)
139.5
124.5%
H1’20
461.4
99.0
560.4
(105.5)
(1.1)
(65.5)
(36.5)
(6.1)
(40.8)
304.9
131.5%
MICROⓇ
FOCUSView entire presentation