Bed Bath & Beyond Results Presentation Deck
Q4 BUSINESS & FINANCIAL RESULTS
strong cash flow generation, balance sheet improvement and
capital return to shareholders
(1)
BED BATH & BEYOND (2)
(3)
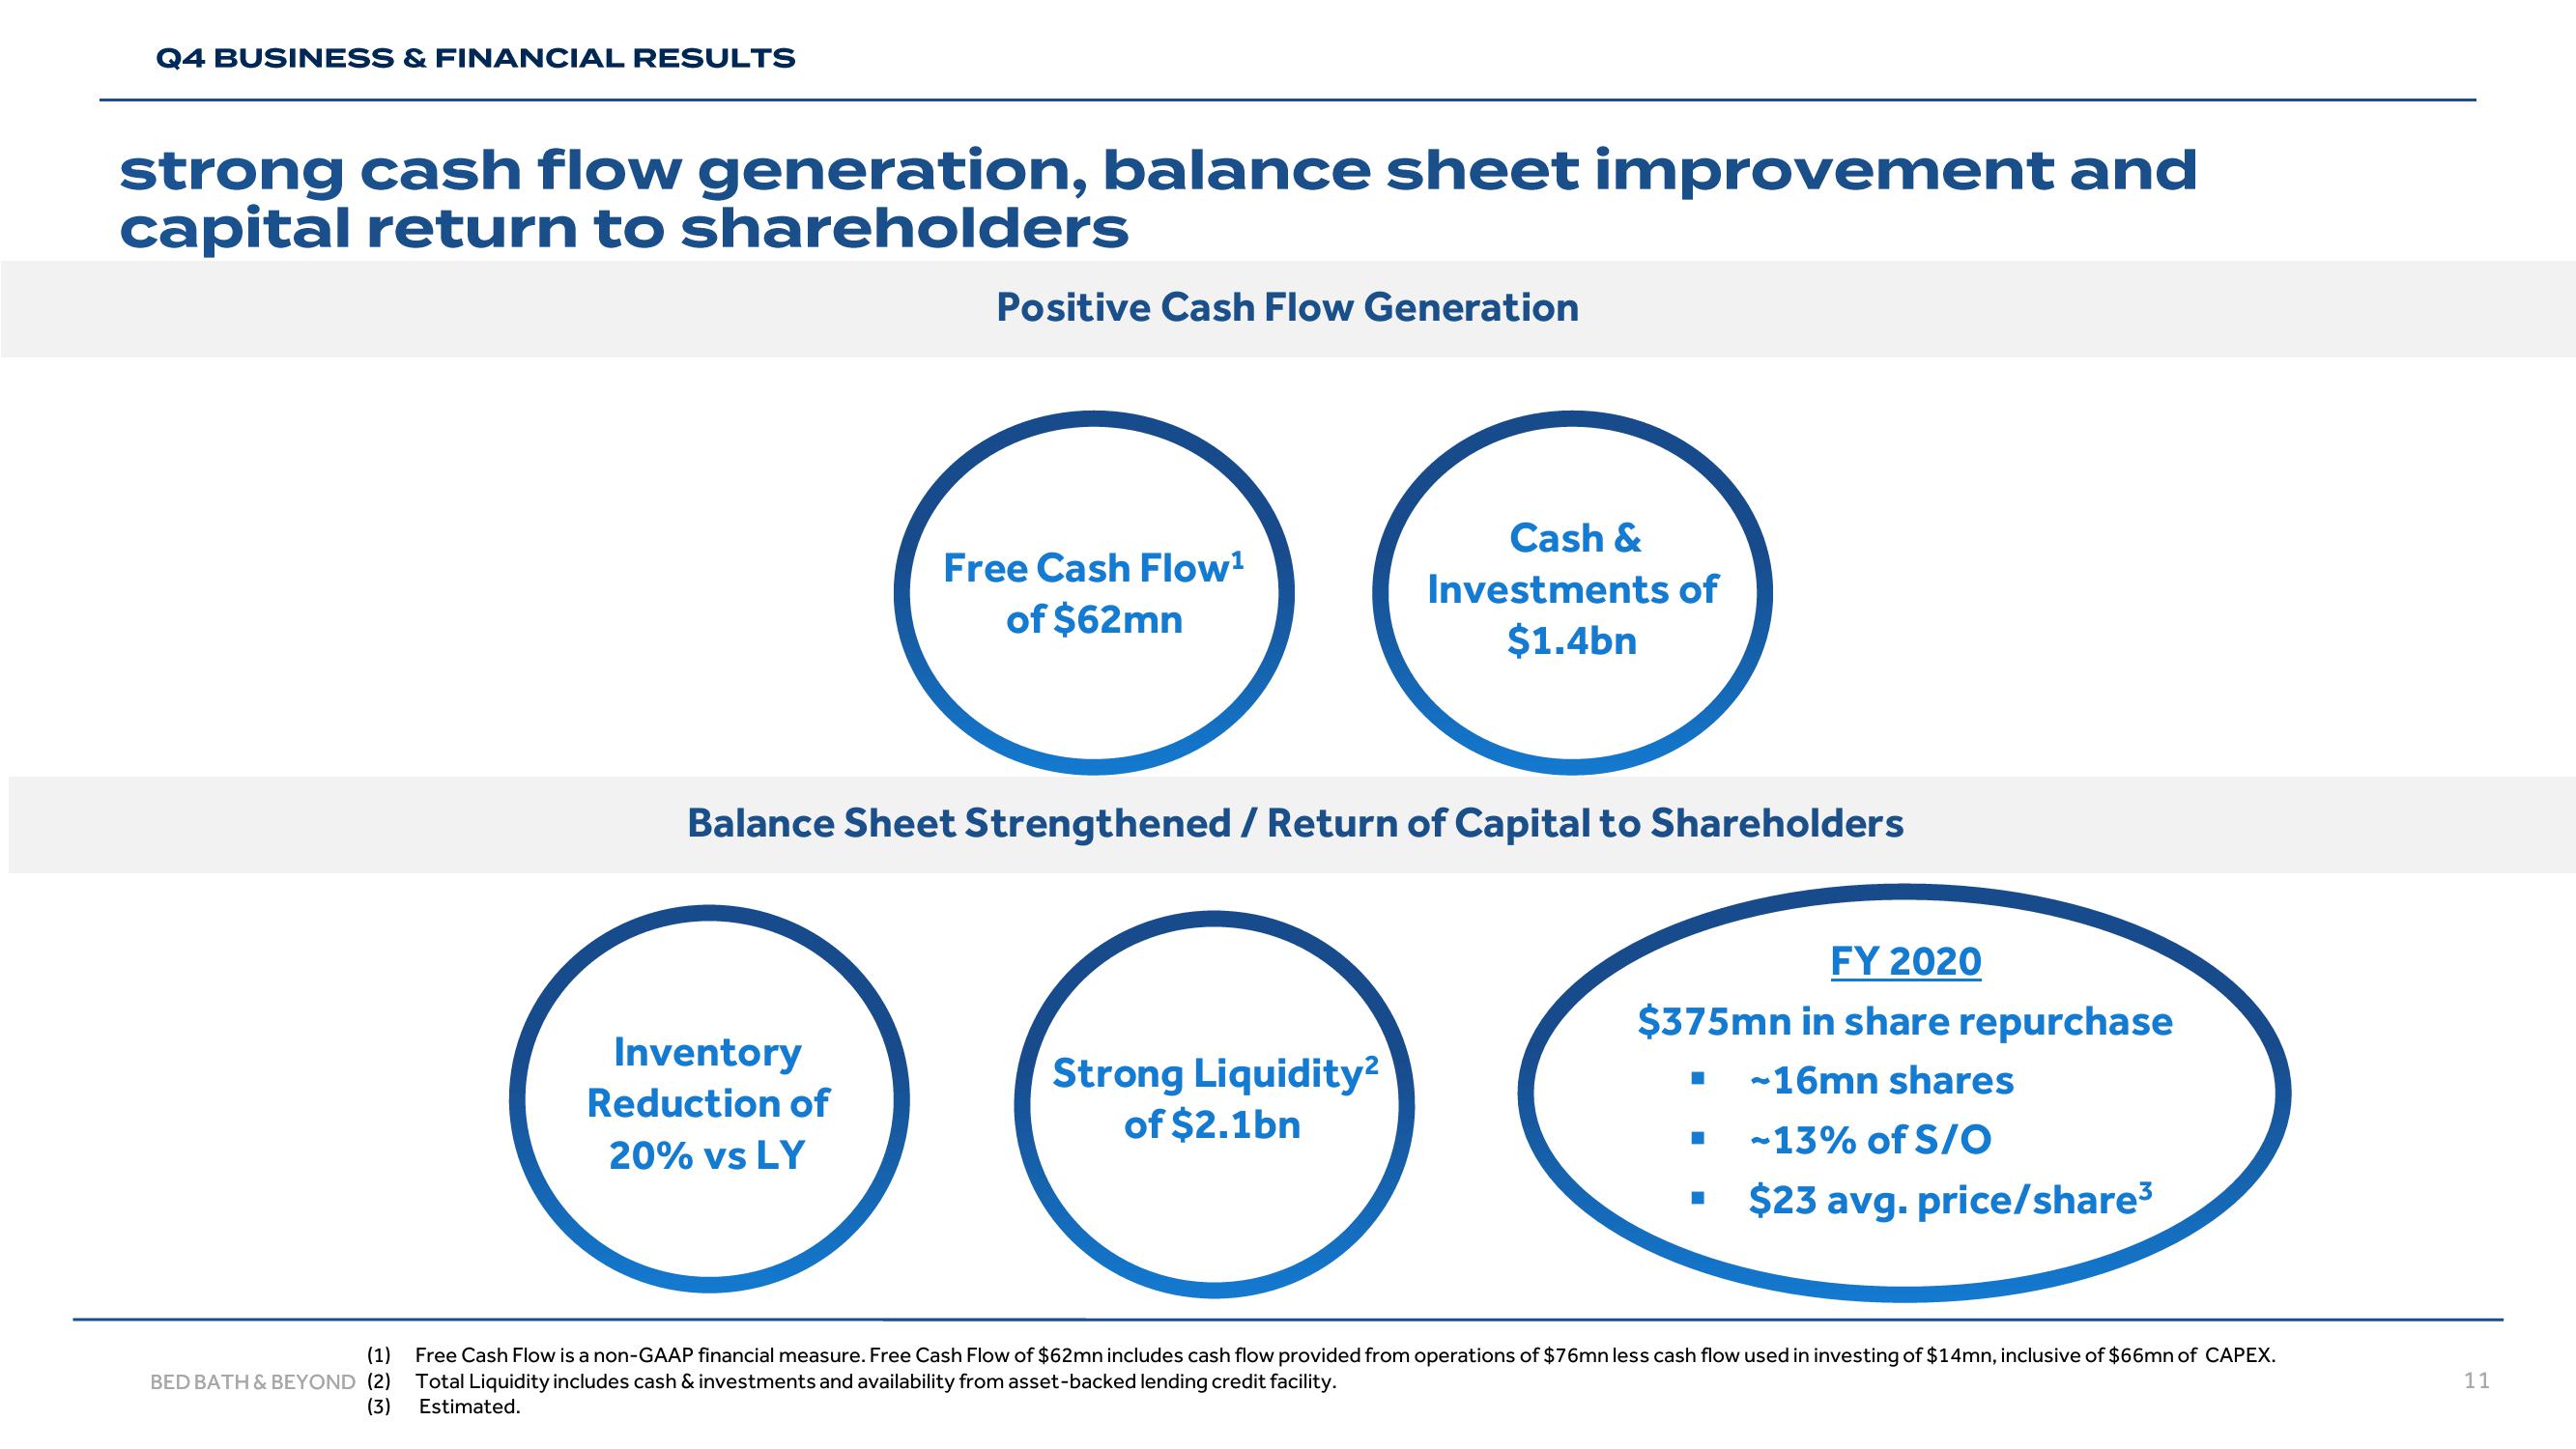
Positive Cash Flow Generation
Inventory
Reduction of
20% vs LY
Free Cash Flow¹
of $62mn
Balance Sheet Strengthened / Return of Capital to Shareholders
Cash &
Investments of
$1.4bn
Strong Liquidity²
of $2.1bn
FY 2020
$375mn in share repurchase
-16mn shares
-13% of S/O
$23 avg. price/share³
■
■
■
Free Cash Flow is a non-GAAP financial measure. Free Cash Flow of $62mn includes cash flow provided from operations of $76mn less cash flow used in investing of $14mn, inclusive of $66mn of CAPEX.
Total Liquidity includes cash & investments and availability from asset-backed lending credit facility.
Estimated.
11View entire presentation