Zegna Results Presentation Deck
GROUP REVENUES BY PRODUCT LINE
(PRELIMINARY AND UNAUDITED)
(€ thousands, except
percentages)
Total revenues
Zegna branded products
Thom Browne
Tom Ford Fashion
Textile
Third Party Brands
Other
H1 2023
Note: "n.m." means not meaningful
903,059
541,319
206,951
64,015
73,072
15,477
2,225
H1 2022
728,993
425,252
185,166
H1 2023 vs H1 2022
Reported Constant Organic
Revenues Currency Growth
23.9%
27.3%
11.8%
n.m.
24.7%
28.4%
13.4%
n.m.
21.5%
28.4%
13.4%
n.m.
68,968
6.0%
5.2%
5.3%
47,341
(67.3%) (68.1%)
(4.4%)
2,266 (1.8%) (2.3%) (2.1%)
Q2 2023
Q2 2022
474,747 351,414
269,430 201,273
94,399
87,229
64,015
39,254
6,567
1,082
Ermenegildo Zegna Group
Q2 2023 vs Q2 2022
Reported Constant Organic
Revenues Currency Growth
35.1%
33.9%
8.2%
n.m.
38,724 1.4%
22,939 (71.4%)
1,249 (13.4%)
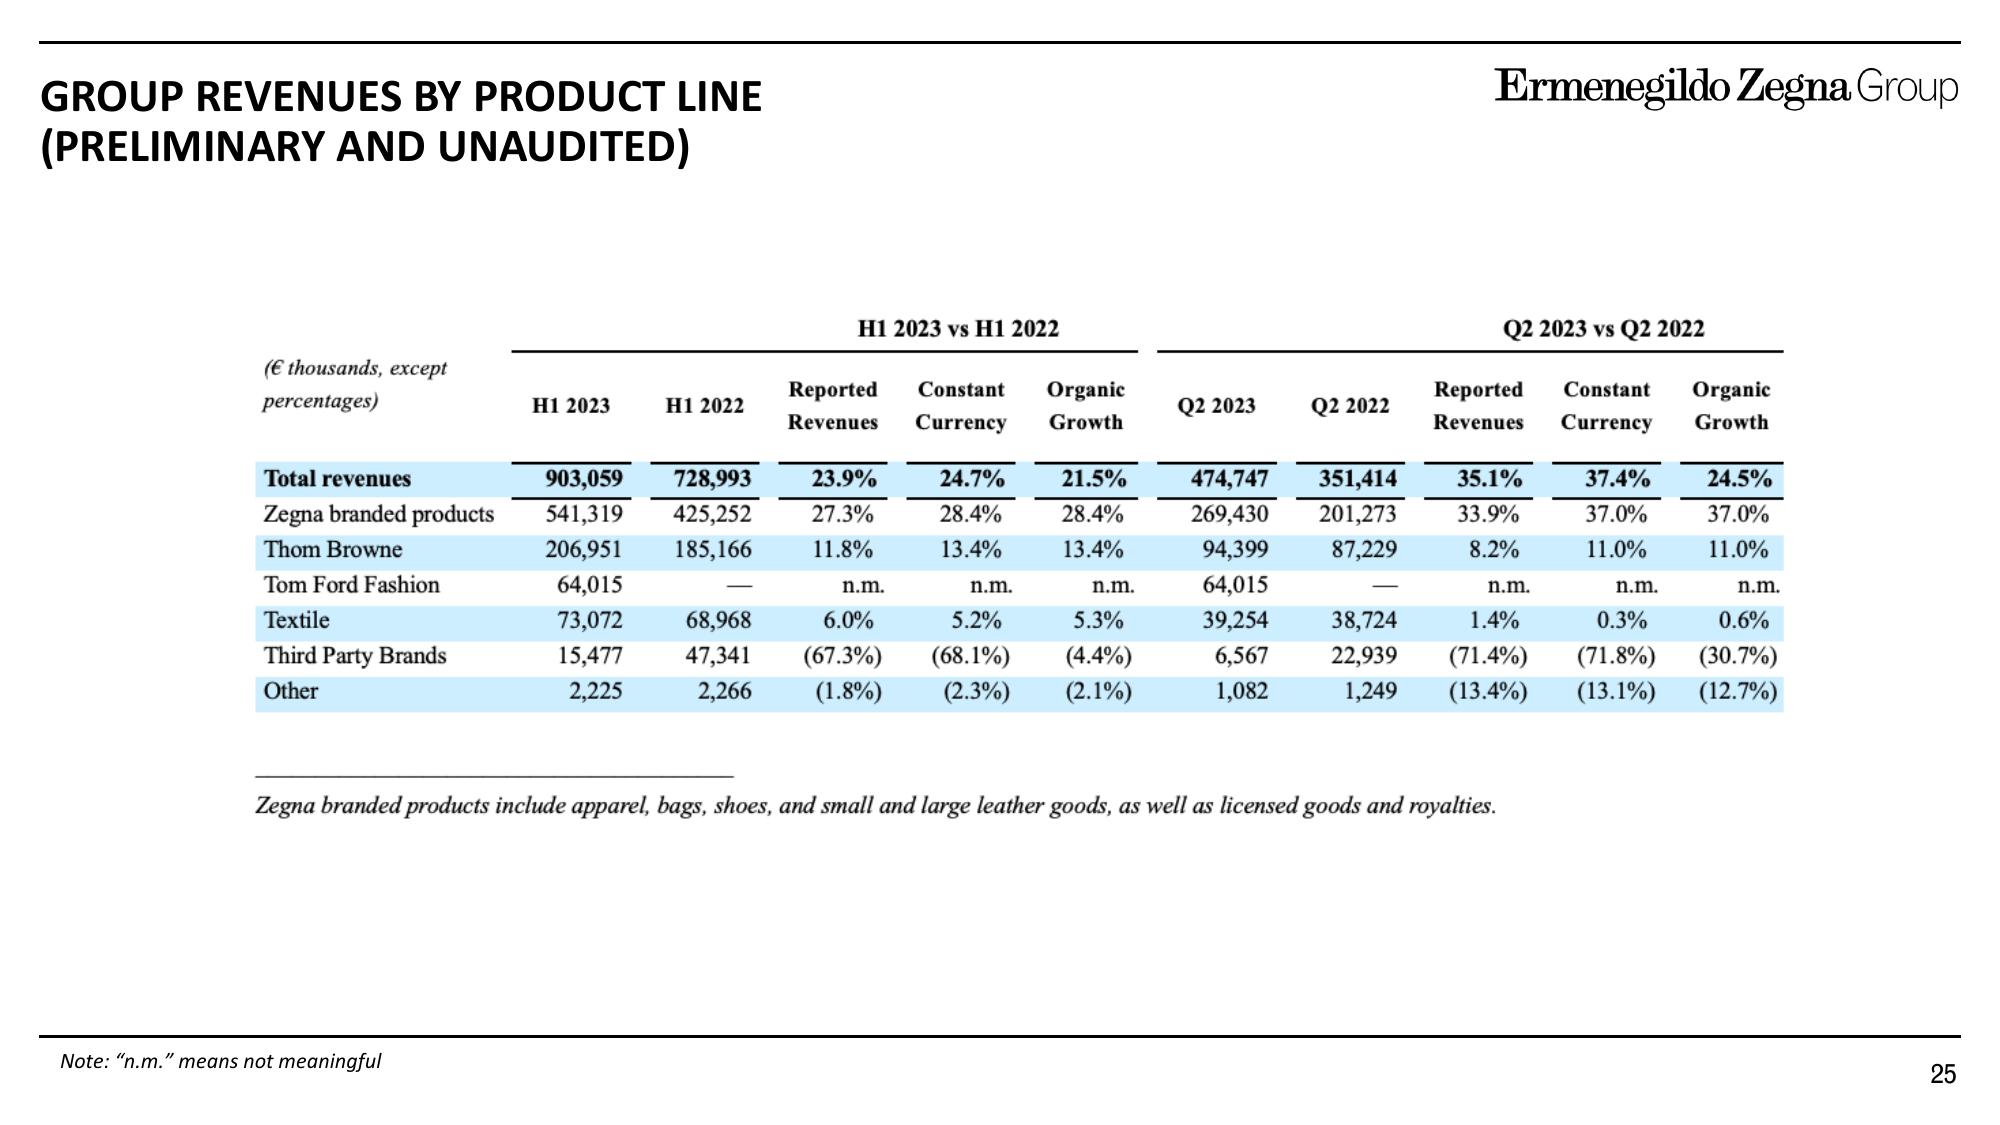
Zegna branded products include apparel, bags, shoes, and small and large leather goods, as well as licensed goods and royalties.
37.4%
37.0%
11.0%
24.5%
37.0%
11.0%
n.m.
n.m.
0.3%
0.6%
(71.8%) (30.7%)
(13.1%) (12.7%)
25View entire presentation