Analyst Day Presentation
58
59
4.
2
2.
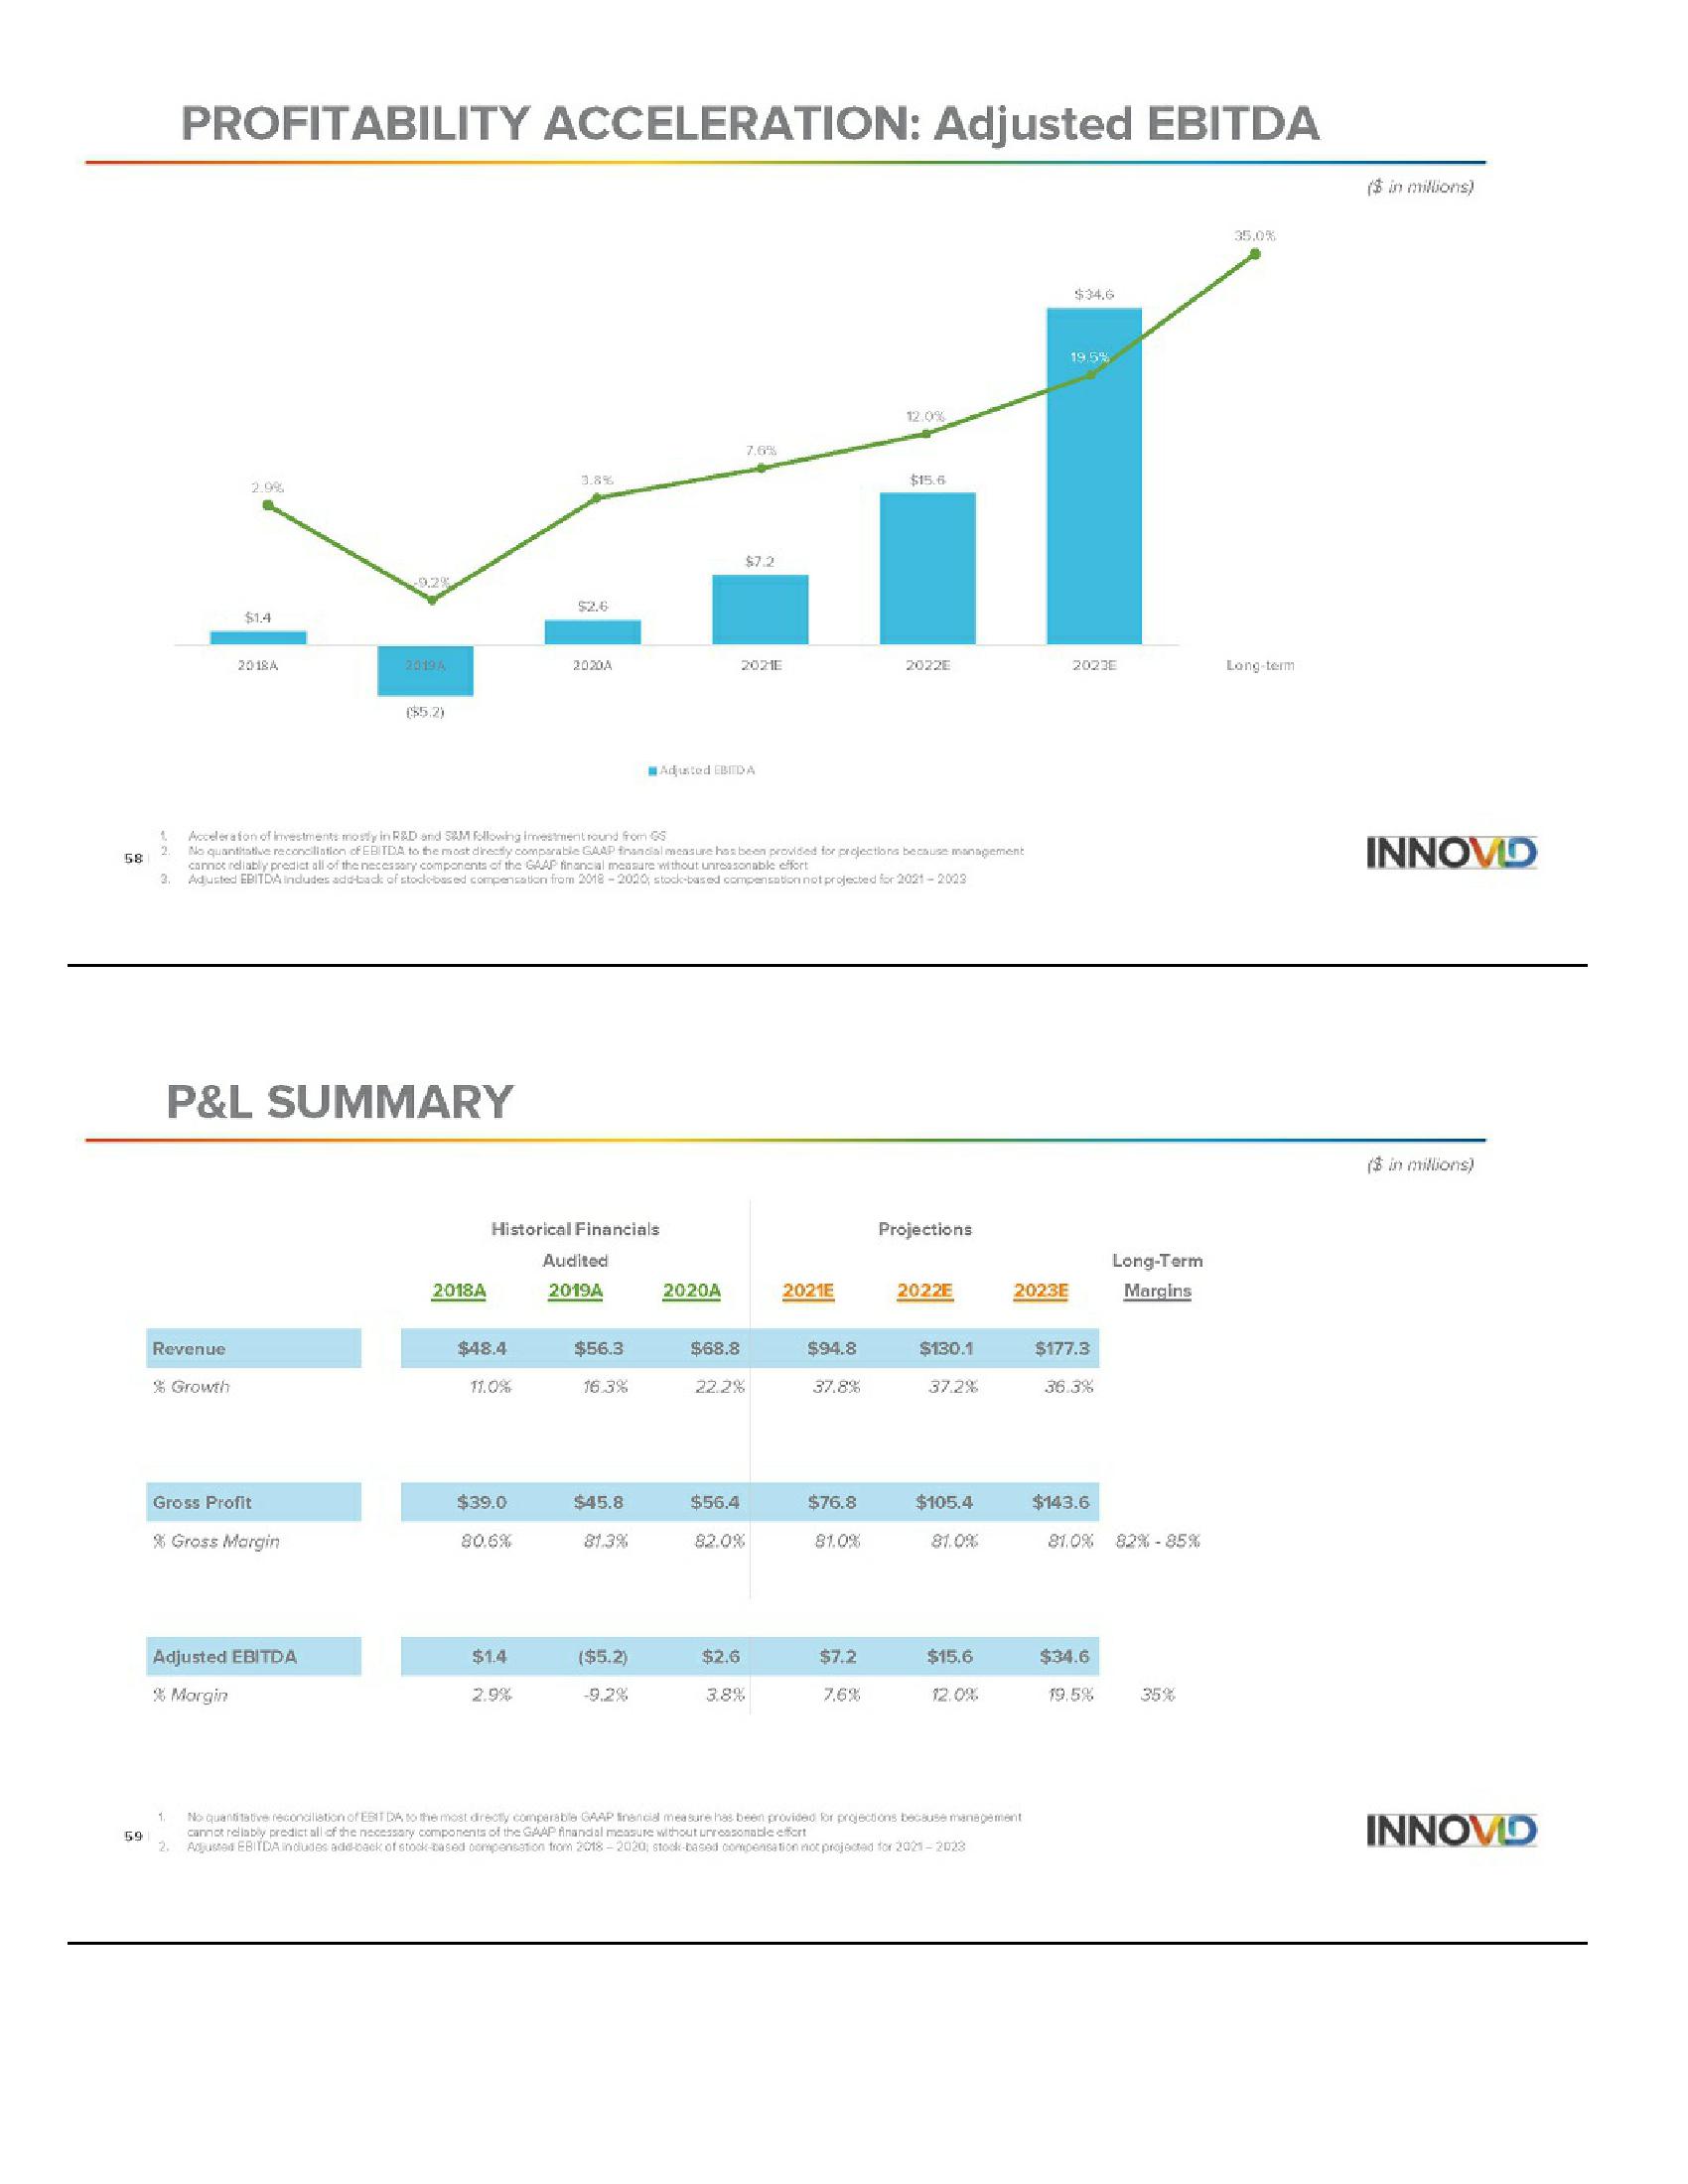
PROFITABILITY ACCELERATION: Adjusted EBITDA
Revenue
$1.4
% Growth
2018A
1.
Gross Profit
P&L SUMMARY
% Gross Margin
-9,2%
Adjusted EBITDA
% Morgin
2019A
($5.2)
Acceleration of investments mostly in R&D and SAM following investment round from GS
No quantitative reconciliation of EBITDA to the most directly comparable GAAP financial measure has been provided for projections because management
cannot reliably predict all of the necessary components of the GAAP financial measure without unreasonable effort
Adjusted EBITDA indudes add-back of stockebased compensation from 2018-2020, stock-based compensation not projected for 2021-2023
2018A
$48.4
11.0%
$2.6
$39.0
80.6%
2030A
Historical Financials
$14
2.9%
Audited
2019A
$56.3
16.3%
$45.8
81.3%
($5.2)
-9,2%
Adjusted EBITDA
2020A
$68.8
2021E
7,6%
22.2%
$56.4
$2.6
3.8%
$34.6
19.5%
12.0%
1
$15.6
2021E
$94.8
37.8%
$76.8
81.0%
2022E
$7.2
7,6%
Projections
2022E
$130.1
37.2%
$105.4
81.0%
$15.6
12.0%
2023E
No quantitative reconciliation of EBITDA to the most directly comparable GAAP financial measure has been provided for projections because management
cannot reliably predict all of the necessary components of the GAAP finandal measure without unreasonable effort
2. Adjusted EBITDA indudes add-back of stock-based compensation from 2018-2020, stock-based compensation not projected for 2021-2023
2023E
$177.3
36.3%
$143.6
81,0% 82% -85%
$34.6
Long-Term
Margins
19.5%
35%
35.0%
Long-term
($ in millions)
INNOVID
($ in millions)
INNOVIDView entire presentation