Amplitude IPO Presentation Deck
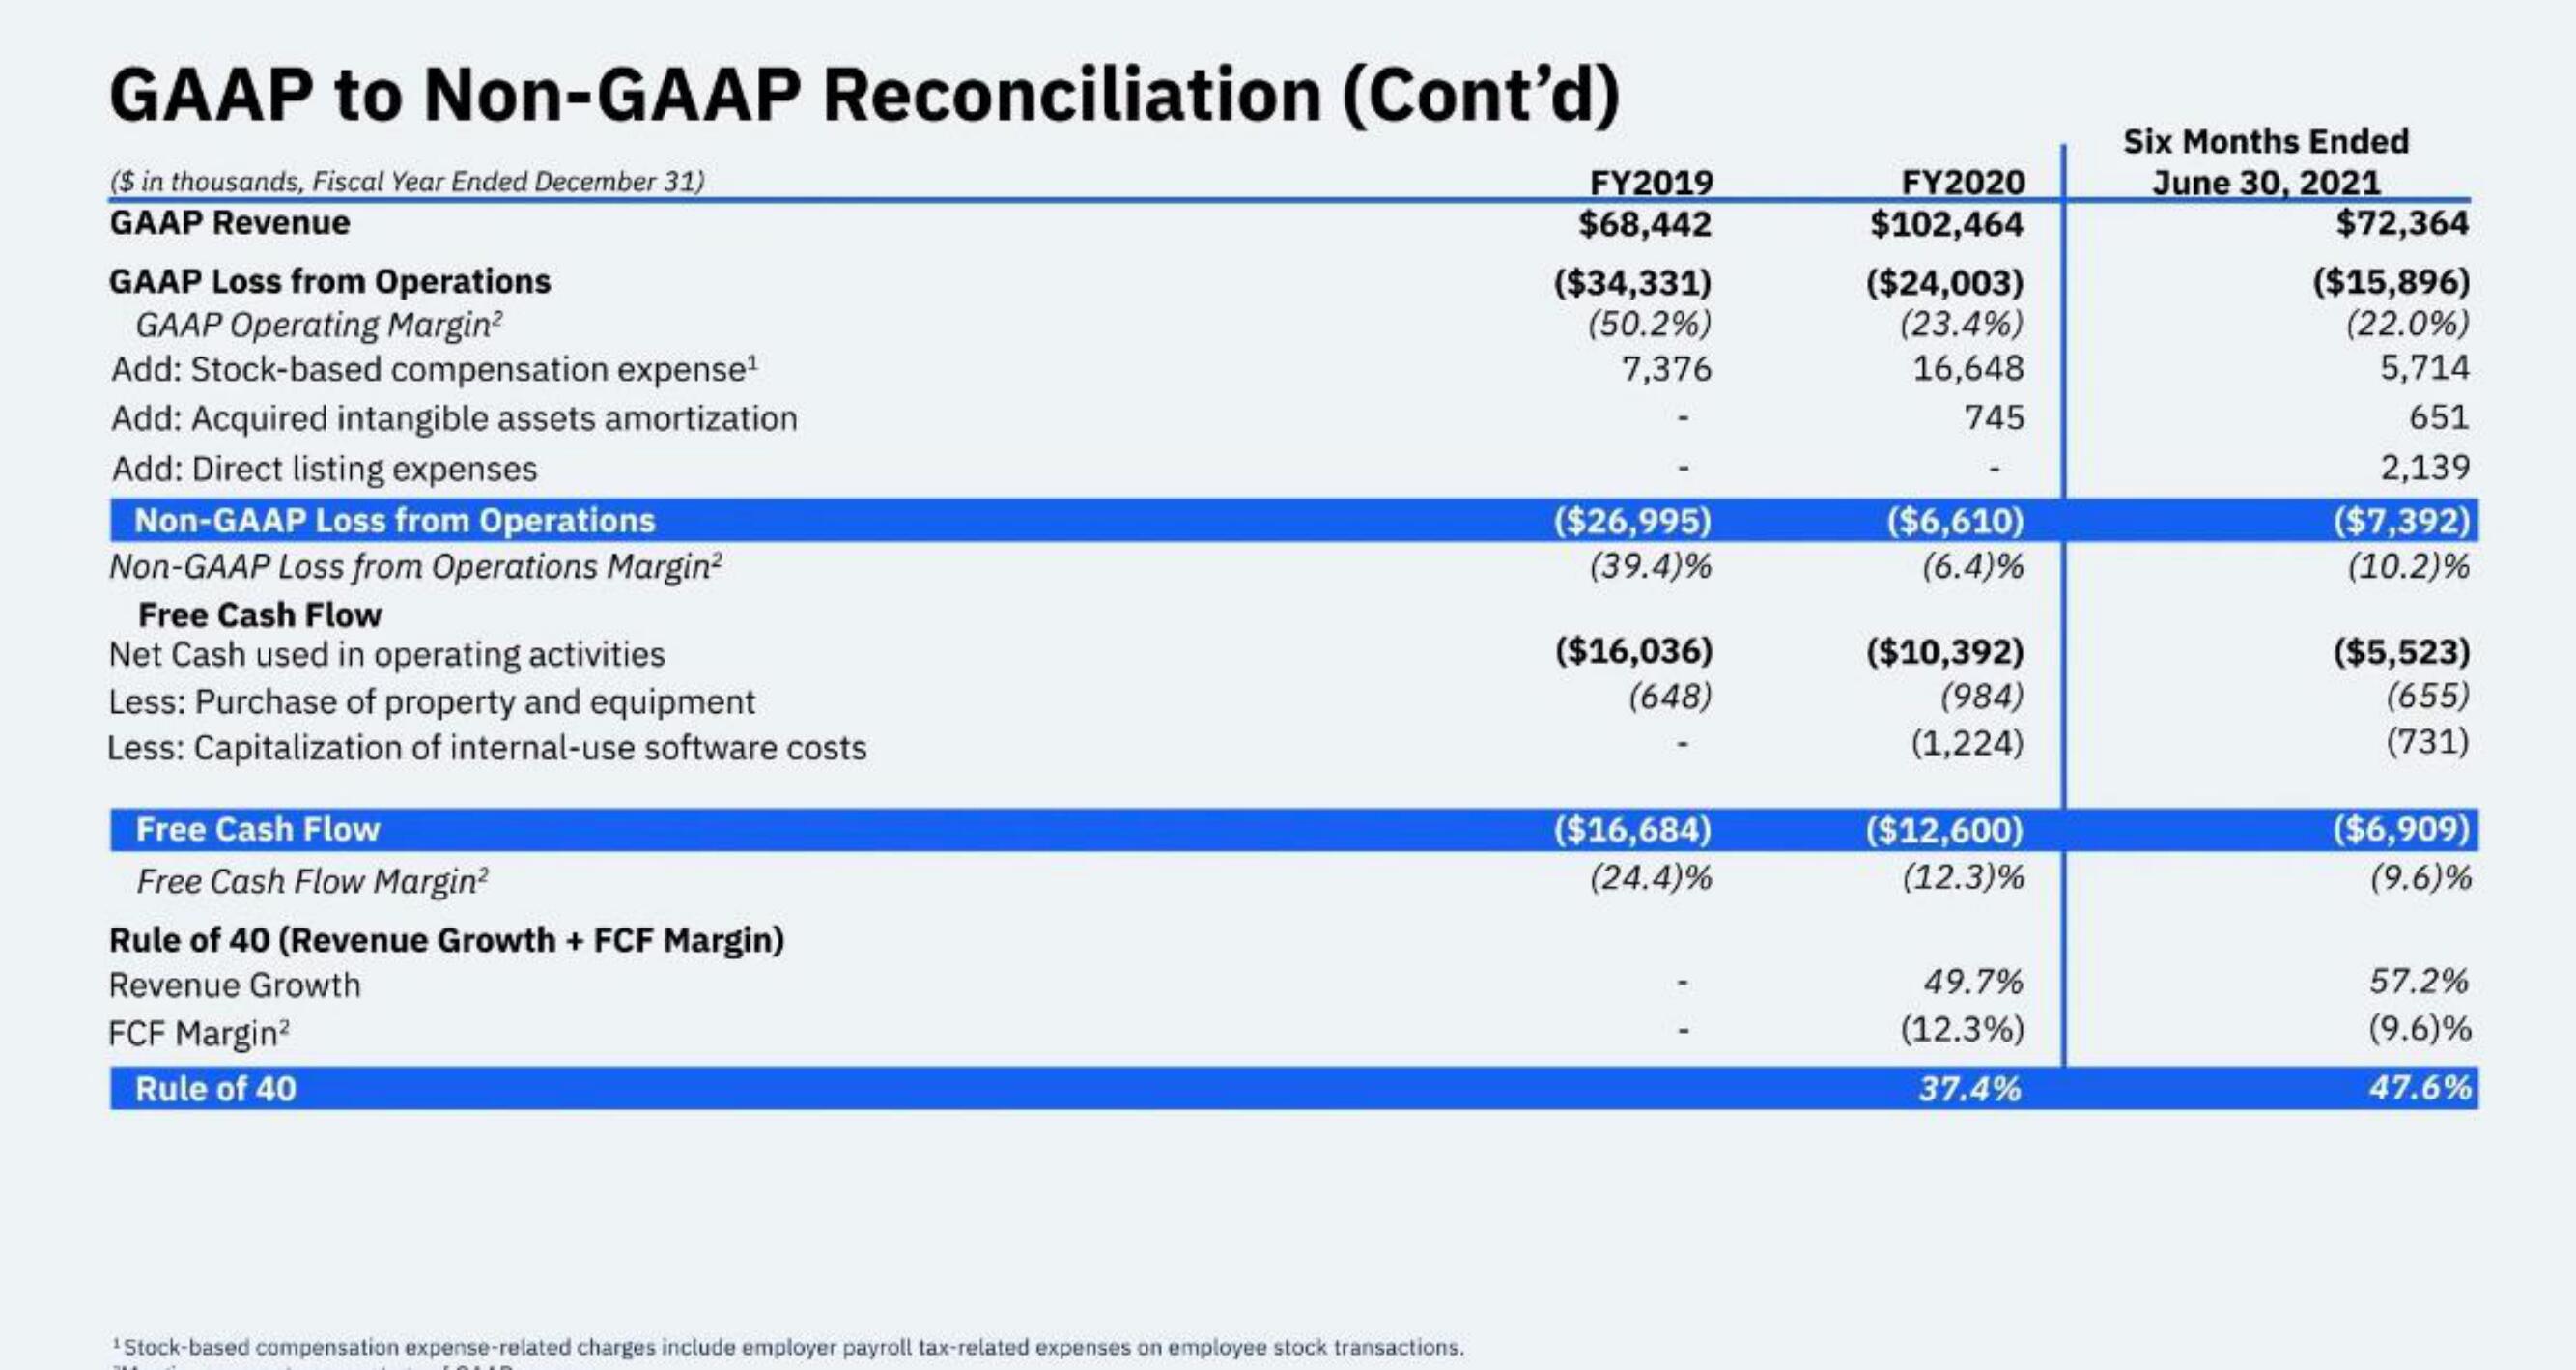
GAAP to Non-GAAP Reconciliation (Cont'd)
($ in thousands, Fiscal Year Ended December 31)
GAAP Revenue
GAAP Loss from Operations
GAAP Operating Margin²
Add: Stock-based compensation expense¹
Add: Acquired intangible assets amortization
Add: Direct listing expenses
Non-GAAP Loss from Operations
Non-GAAP Loss from Operations Margin²
Free Cash Flow
Net Cash used in operating activities
Less: Purchase of property and equipment
Less: Capitalization of internal-use software costs
Free Cash Flow
Free Cash Flow Margin²
Rule of 40 (Revenue Growth + FCF Margin)
Revenue Growth
FCF Margin²
Rule of 40
¹Stock-based compensation expense-related charges include employer payroll tax-related expenses on employee stock transactions.
FY2019
$68,442
($34,331)
(50.2%)
7,376
($26,995)
(39.4)%
($16,036)
(648)
($16,684)
(24.4)%
FY2020
$102,464
($24,003)
(23.4%)
16,648
745
($6,610)
(6.4)%
($10,392)
(984)
(1,224)
($12,600)
(12.3)%
49.7%
(12.3%)
37.4%
Six Months Ended
June 30, 2021
$72,364
($15,896)
(22.0%)
5,714
651
2,139
($7,392)
(10.2)%
($5,523)
(655)
(731)
($6,909)
(9.6)%
57.2%
(9.6)%
47.6%View entire presentation