Credit Suisse Investment Banking Pitch Book
CONFIDENTIAL
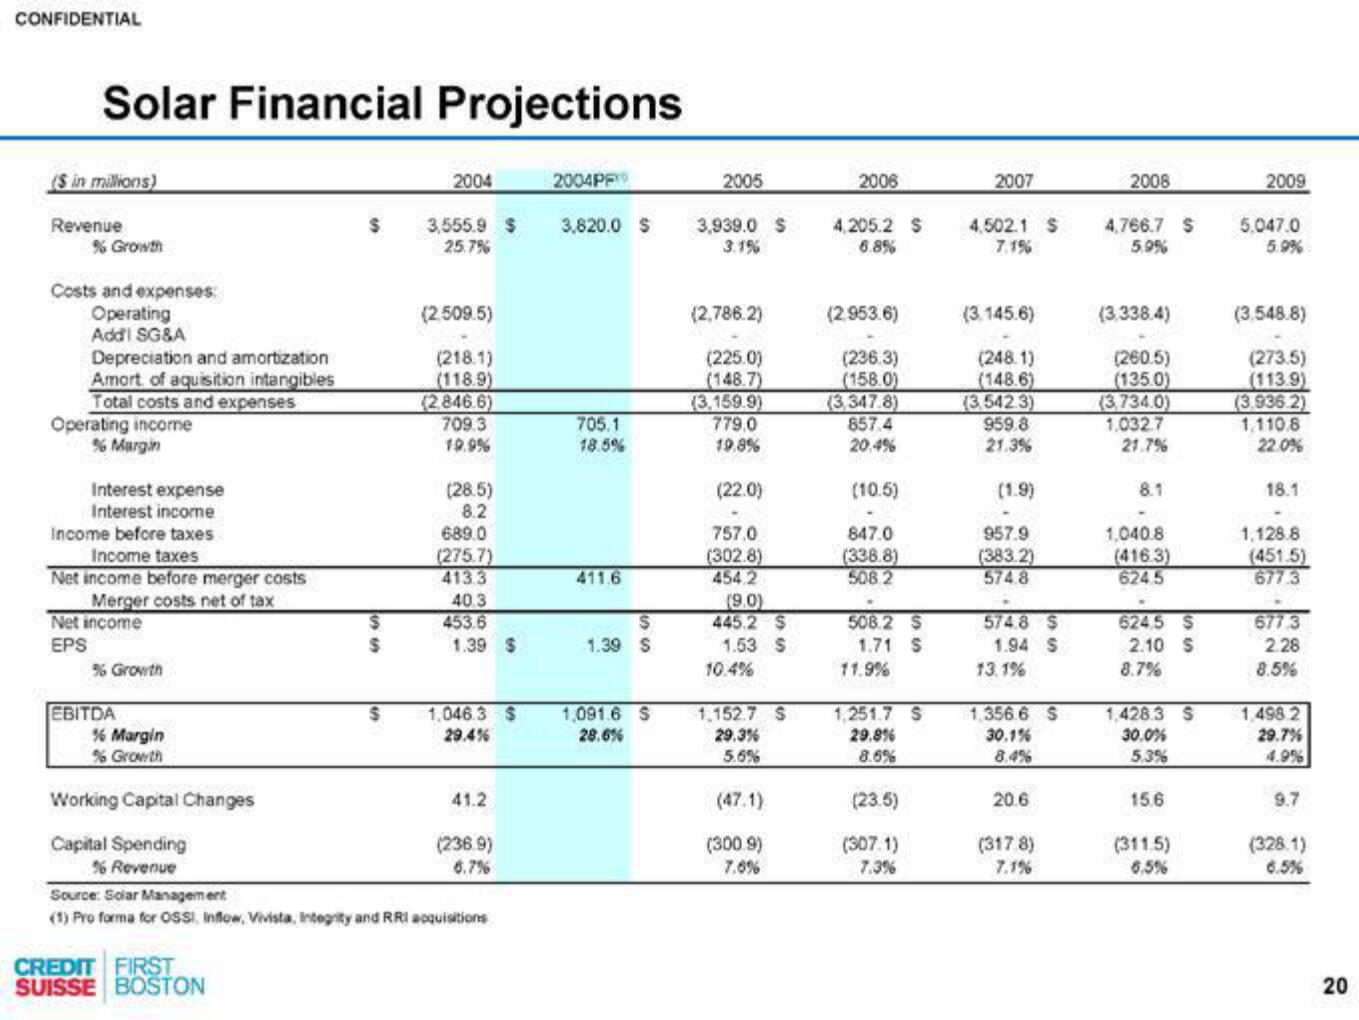
Solar Financial Projections
($ in millions)
Revenue
% Growth
Costs and expenses:
Operating
Addi SG&A
Depreciation and amortization
Amort of aquisition intangibles
Total costs and expenses
Operating income
% Margin
Interest expense
Interest income
Income before taxes
Income taxes
Net income before merger costs
Merger costs net of tax
Net income
EPS
% Growth
EBITDA
% Margin
% Growth
Working Capital Changes
Capital Spending
% Revenue
$
CREDIT FIRST
SUISSE BOSTON
$
$
$
2004
3,555.9 $
25.7%
(2.509.5)
(218.1)
(118.9)
(2,846.6)
709.3
19.9%
(28.5)
8.2
689.0
(275.7)
413.3
40.3
453.6
1.39 $
1,046.3 S
29.4%
41.2
(236.9)
6.7%
Source: Solar Management
(1) Pro forma for OSSI, Inflow, Vivista, Integrity and RRI acquisitions
2004PF
3,820.0 S
705.1
18.5%
411.6
S
1.39 S
1,091.6 S
28.6%
2005
3,939.0 S
3.1%
(2,786.2)
(225.0)
(148.7)
(3,159.9)
779.0
19.8%
(22.0)
757.0
(302.8)
454.2
(9.0)
445.2 S
1.53 S
10.4%
1,152.7 S
29.3%
5.6%
(47.1)
(300.9)
7.6%
2006
4,205.2 S
6.8%
(2.953.6)
(236.3)
(158.0)
(3,347.8)
857.4
20.4%
(10.5)
847.0
(338.8)
508.2
508.2 S
1.71 S
11.9%
1,251.7 S
29.8%
8.6%
(23.5)
(307.1)
7.3%
2007
4.502.1 S
7.1%
(3.145.6)
(248.1)
(148.6)
(3.542.3)
959.8
21.3%
(1.9)
957.9
(383.2)
574.8
574.8 S
1.94 S
13.1%
1.356.6 S
30.1%
8.4%
20.6
(317.8)
7.1%
2008
4,766.7 S
5.9%
(3.338.4)
(260.5)
(135.0)
(3.734.0)
1,032.7
21.7%
8.1
1,040.8
(416.3)
624.5
624.5 S
2.10 S
8.7%
1,428.3 S
30.0%
5.3%
15.6
(311.5)
6.5%
2009
5,047.0
5.9%
(3.548.8)
(273.5)
(113.9)
(3.936.2)
1.110.8
22.0%
18.1
1,128.8
(451.5)
677.3
677 3
2.28
8.5%
1,498.2
29.7%
4.9%
9.7
(328.1)
6.5%
20View entire presentation