Grab Results Presentation Deck
Business Update
Increasing engagement within our Superapp
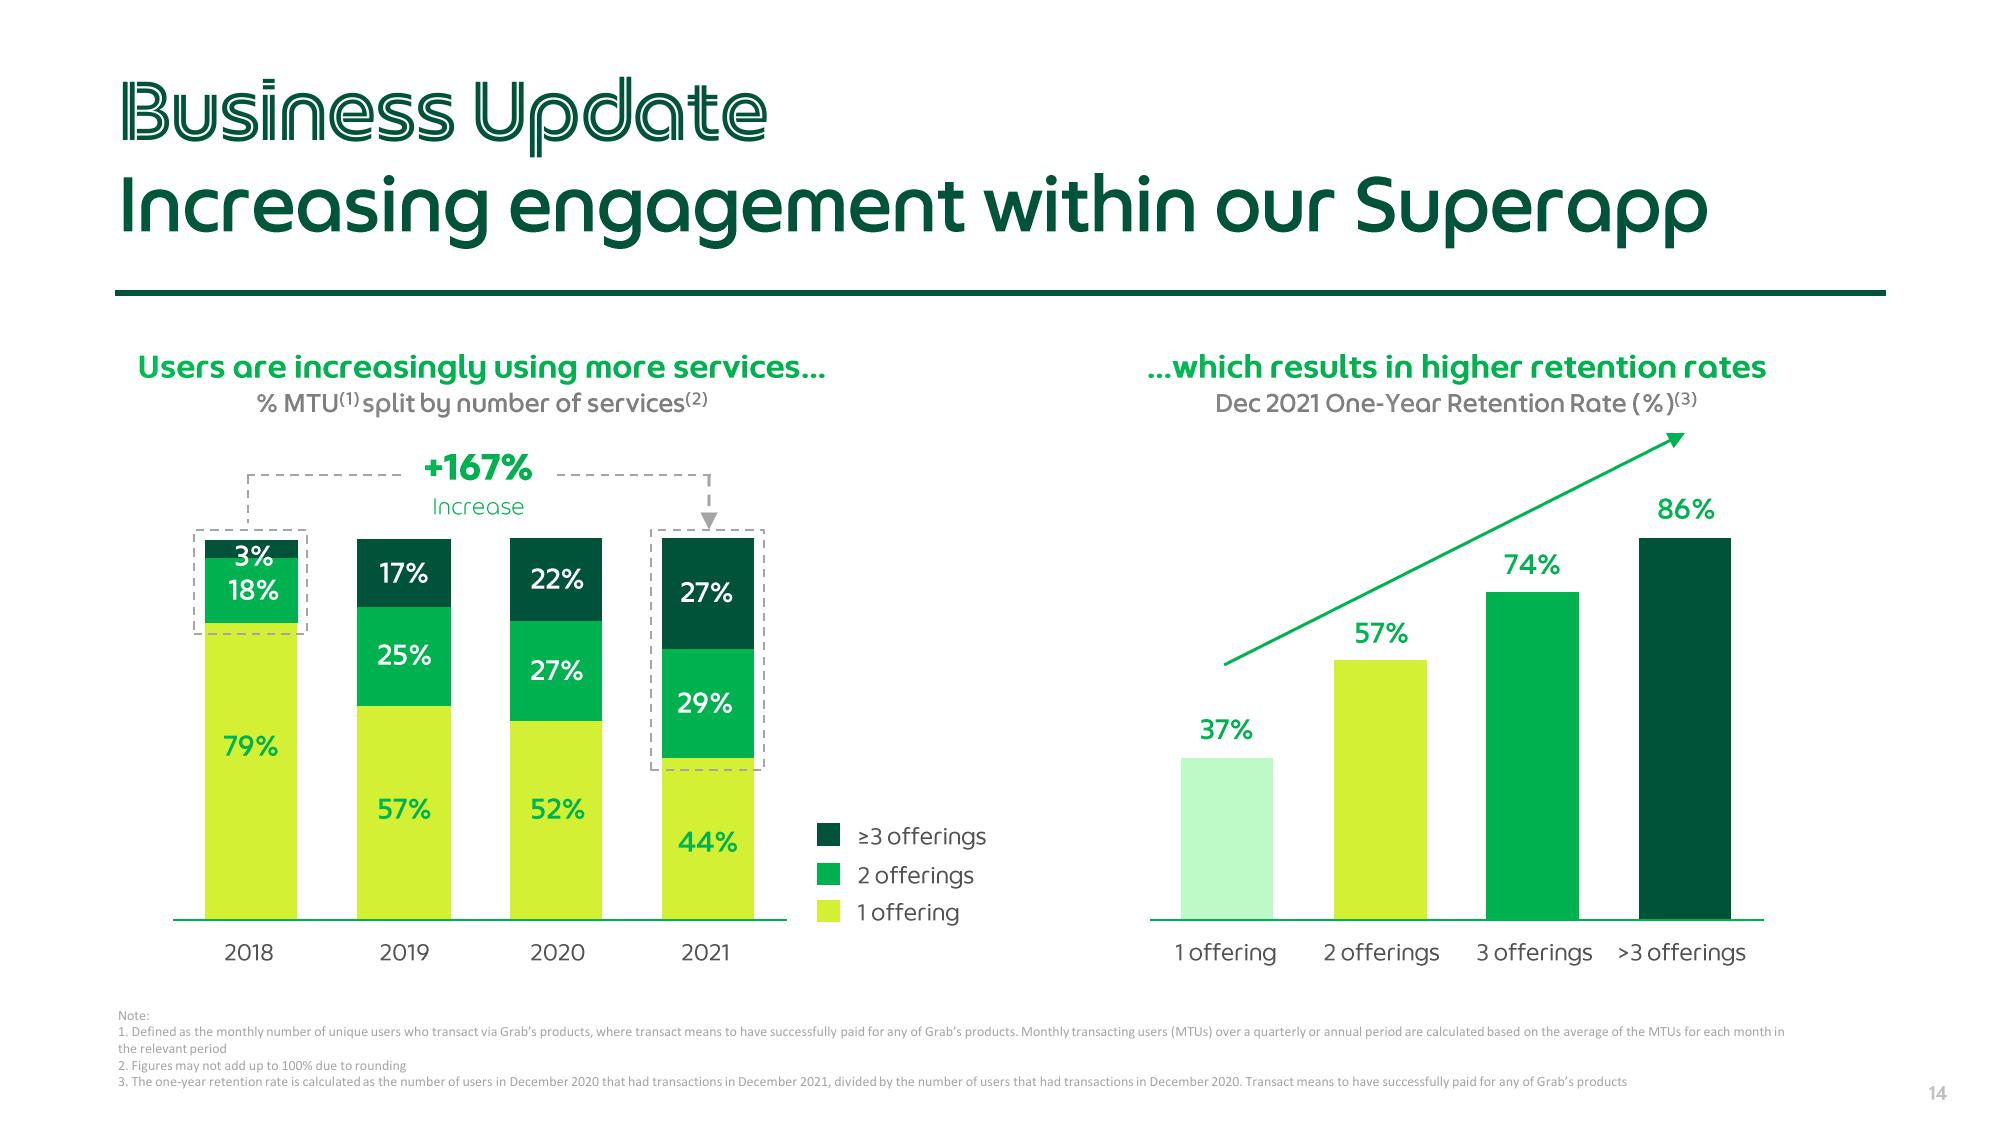
Users are increasingly using more services...
% MTU(¹) split by number of services (2)
3%
18%
79%
2018
+167%
Increase
17%
25%
57%
2019
22%
27%
52%
2020
27%
29%
44%
2021
23 offerings
2 offerings
1 offering
...which results in higher retention rates
Dec 2021 One-Year Retention Rate (%)(3)
37%
1 offering
57%
74%
86%
2 offerings 3 offerings >3 offerings
Note:
1. Defined as the monthly number of unique users who transact via Grab's products, where transact means to have successfully paid for any of Grab's products. Monthly transacting users (MTUS) over a quarterly or annual period are calculated based on the average of the MTUs for each month in
the relevant period
2. Figures may not add up to 100% due to rounding
3. The one-year retention rate is calculated as the number of users in December 2020 that had transactions in December 2021, divided by the number of users that had transactions in December 2020. Transact means to have successfully paid for any of Grab's products
14View entire presentation