Q2 Quarter 2023
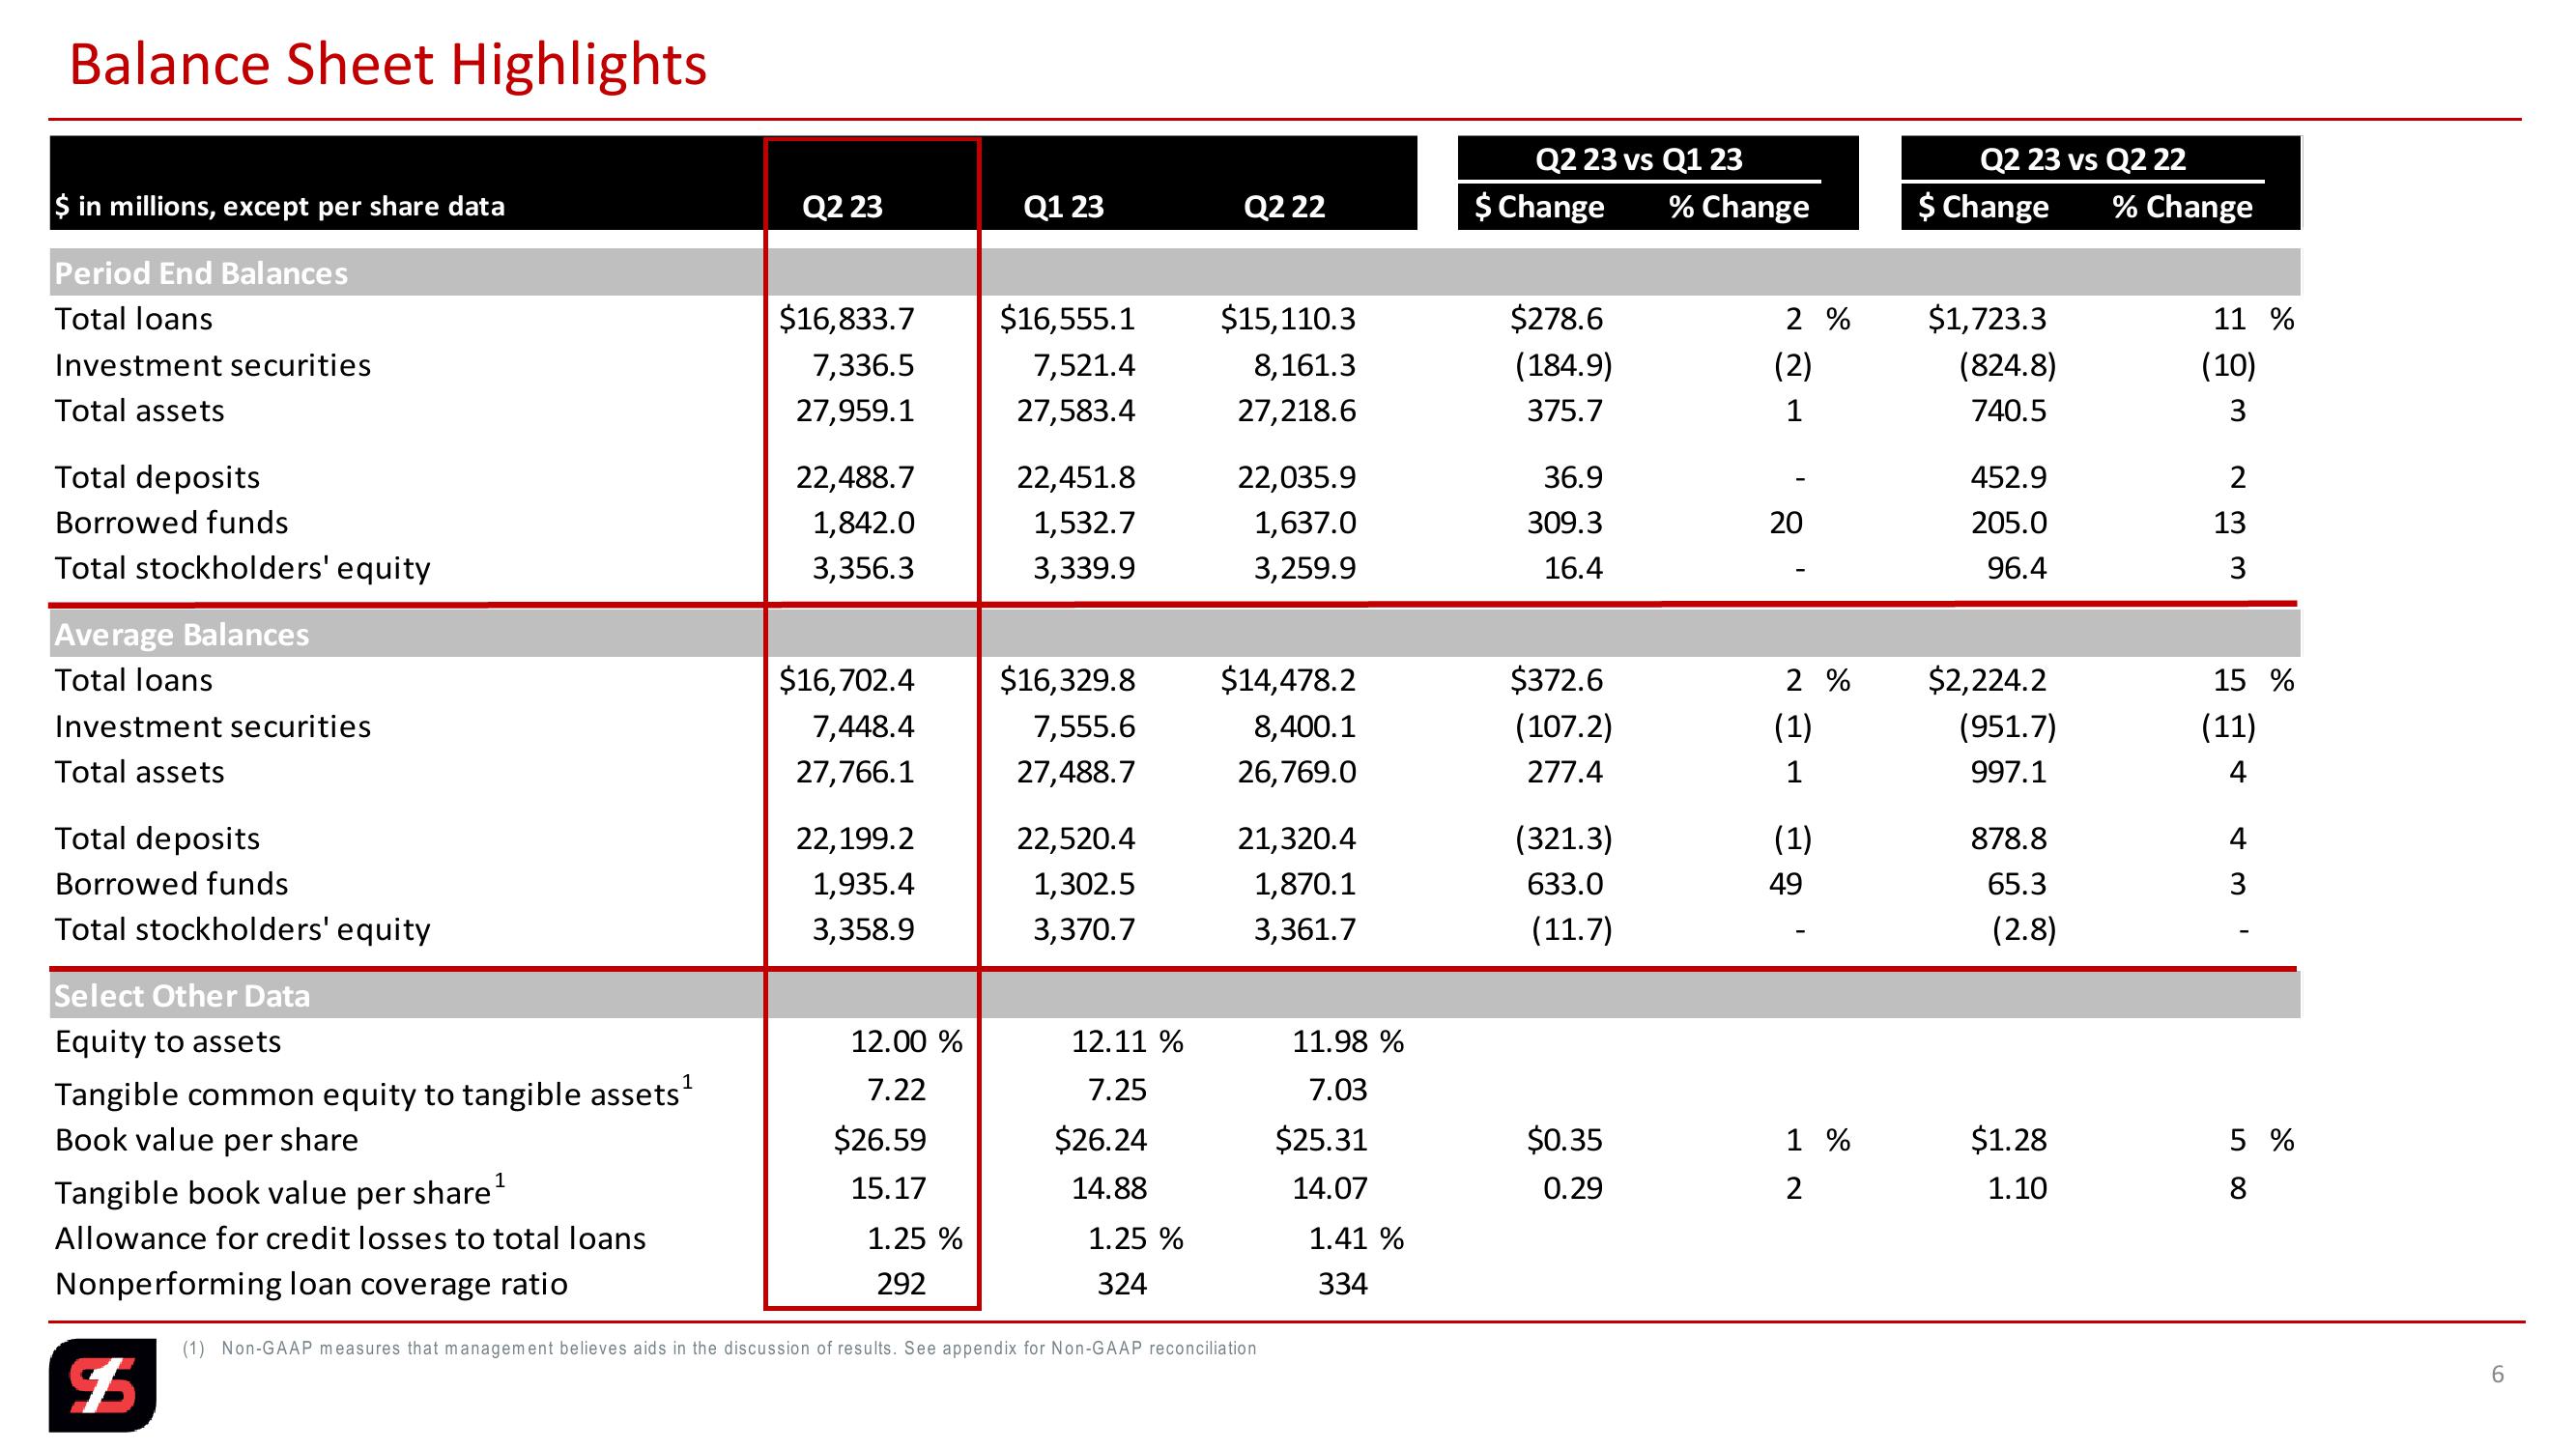
Balance Sheet Highlights
$ in millions, except per share data
Period End Balances
Total loans
Q2 23 vs Q1 23
Q2 23
Q1 23
Q2 22
$ Change
Q2 23 vs Q2 22
% Change
$ Change
% Change
$16,833.7
$16,555.1
$15,110.3
$278.6
2 %
Investment securities
7,336.5
7,521.4
8,161.3
(184.9)
(2)
Total assets
27,959.1
27,583.4
27,218.6
375.7
$1,723.3
(824.8)
740.5
11 %
(10)
3
Total deposits
22,488.7
22,451.8
22,035.9
36.9
452.9
2
Borrowed funds
1,842.0
1,532.7
1,637.0
309.3
20
20
205.0
13
Total stockholders' equity
3,356.3
3,339.9
3,259.9
16.4
96.4 3
3
Average Balances
Total loans
Investment securities
Total assets
Total deposits
Borrowed funds
Total stockholders' equity
Select Other Data
$16,702.4
$16,329.8
$14,478.2
$372.6
2 %
7,448.4
7,555.6
8,400.1
(107.2)
(1)
27,766.1
27,488.7
26,769.0
277.4
1
$2,224.2
(951.7)
997.1
15 %
(11)
4
22,199.2
22,520.4
21,320.4
(321.3)
(1)
878.8
1,935.4
1,302.5
1,870.1
3,358.9
3,370.7
3,361.7
633.0
(11.7)
49
65.3
(2.8)
+31
4
Equity to assets
12.00 %
12.11%
11.98 %
Tangible common equity to tangible assets¹
Book value per share
Tangible book value per share¹
1
7.22
7.25
7.03
$26.59
15.17
$26.24
14.88
$25.31
14.07
$0.35
0.29
1 %
$1.28
2
1.10
58
5 %
Allowance for credit losses to total loans
1.25 %
1.25 %
1.41 %
Nonperforming loan coverage ratio
292
324
334
(1) Non-GAAP measures that management believes aids in the discussion of results. See appendix for Non-GAAP reconciliation
$
6View entire presentation