Wix Results Presentation Deck
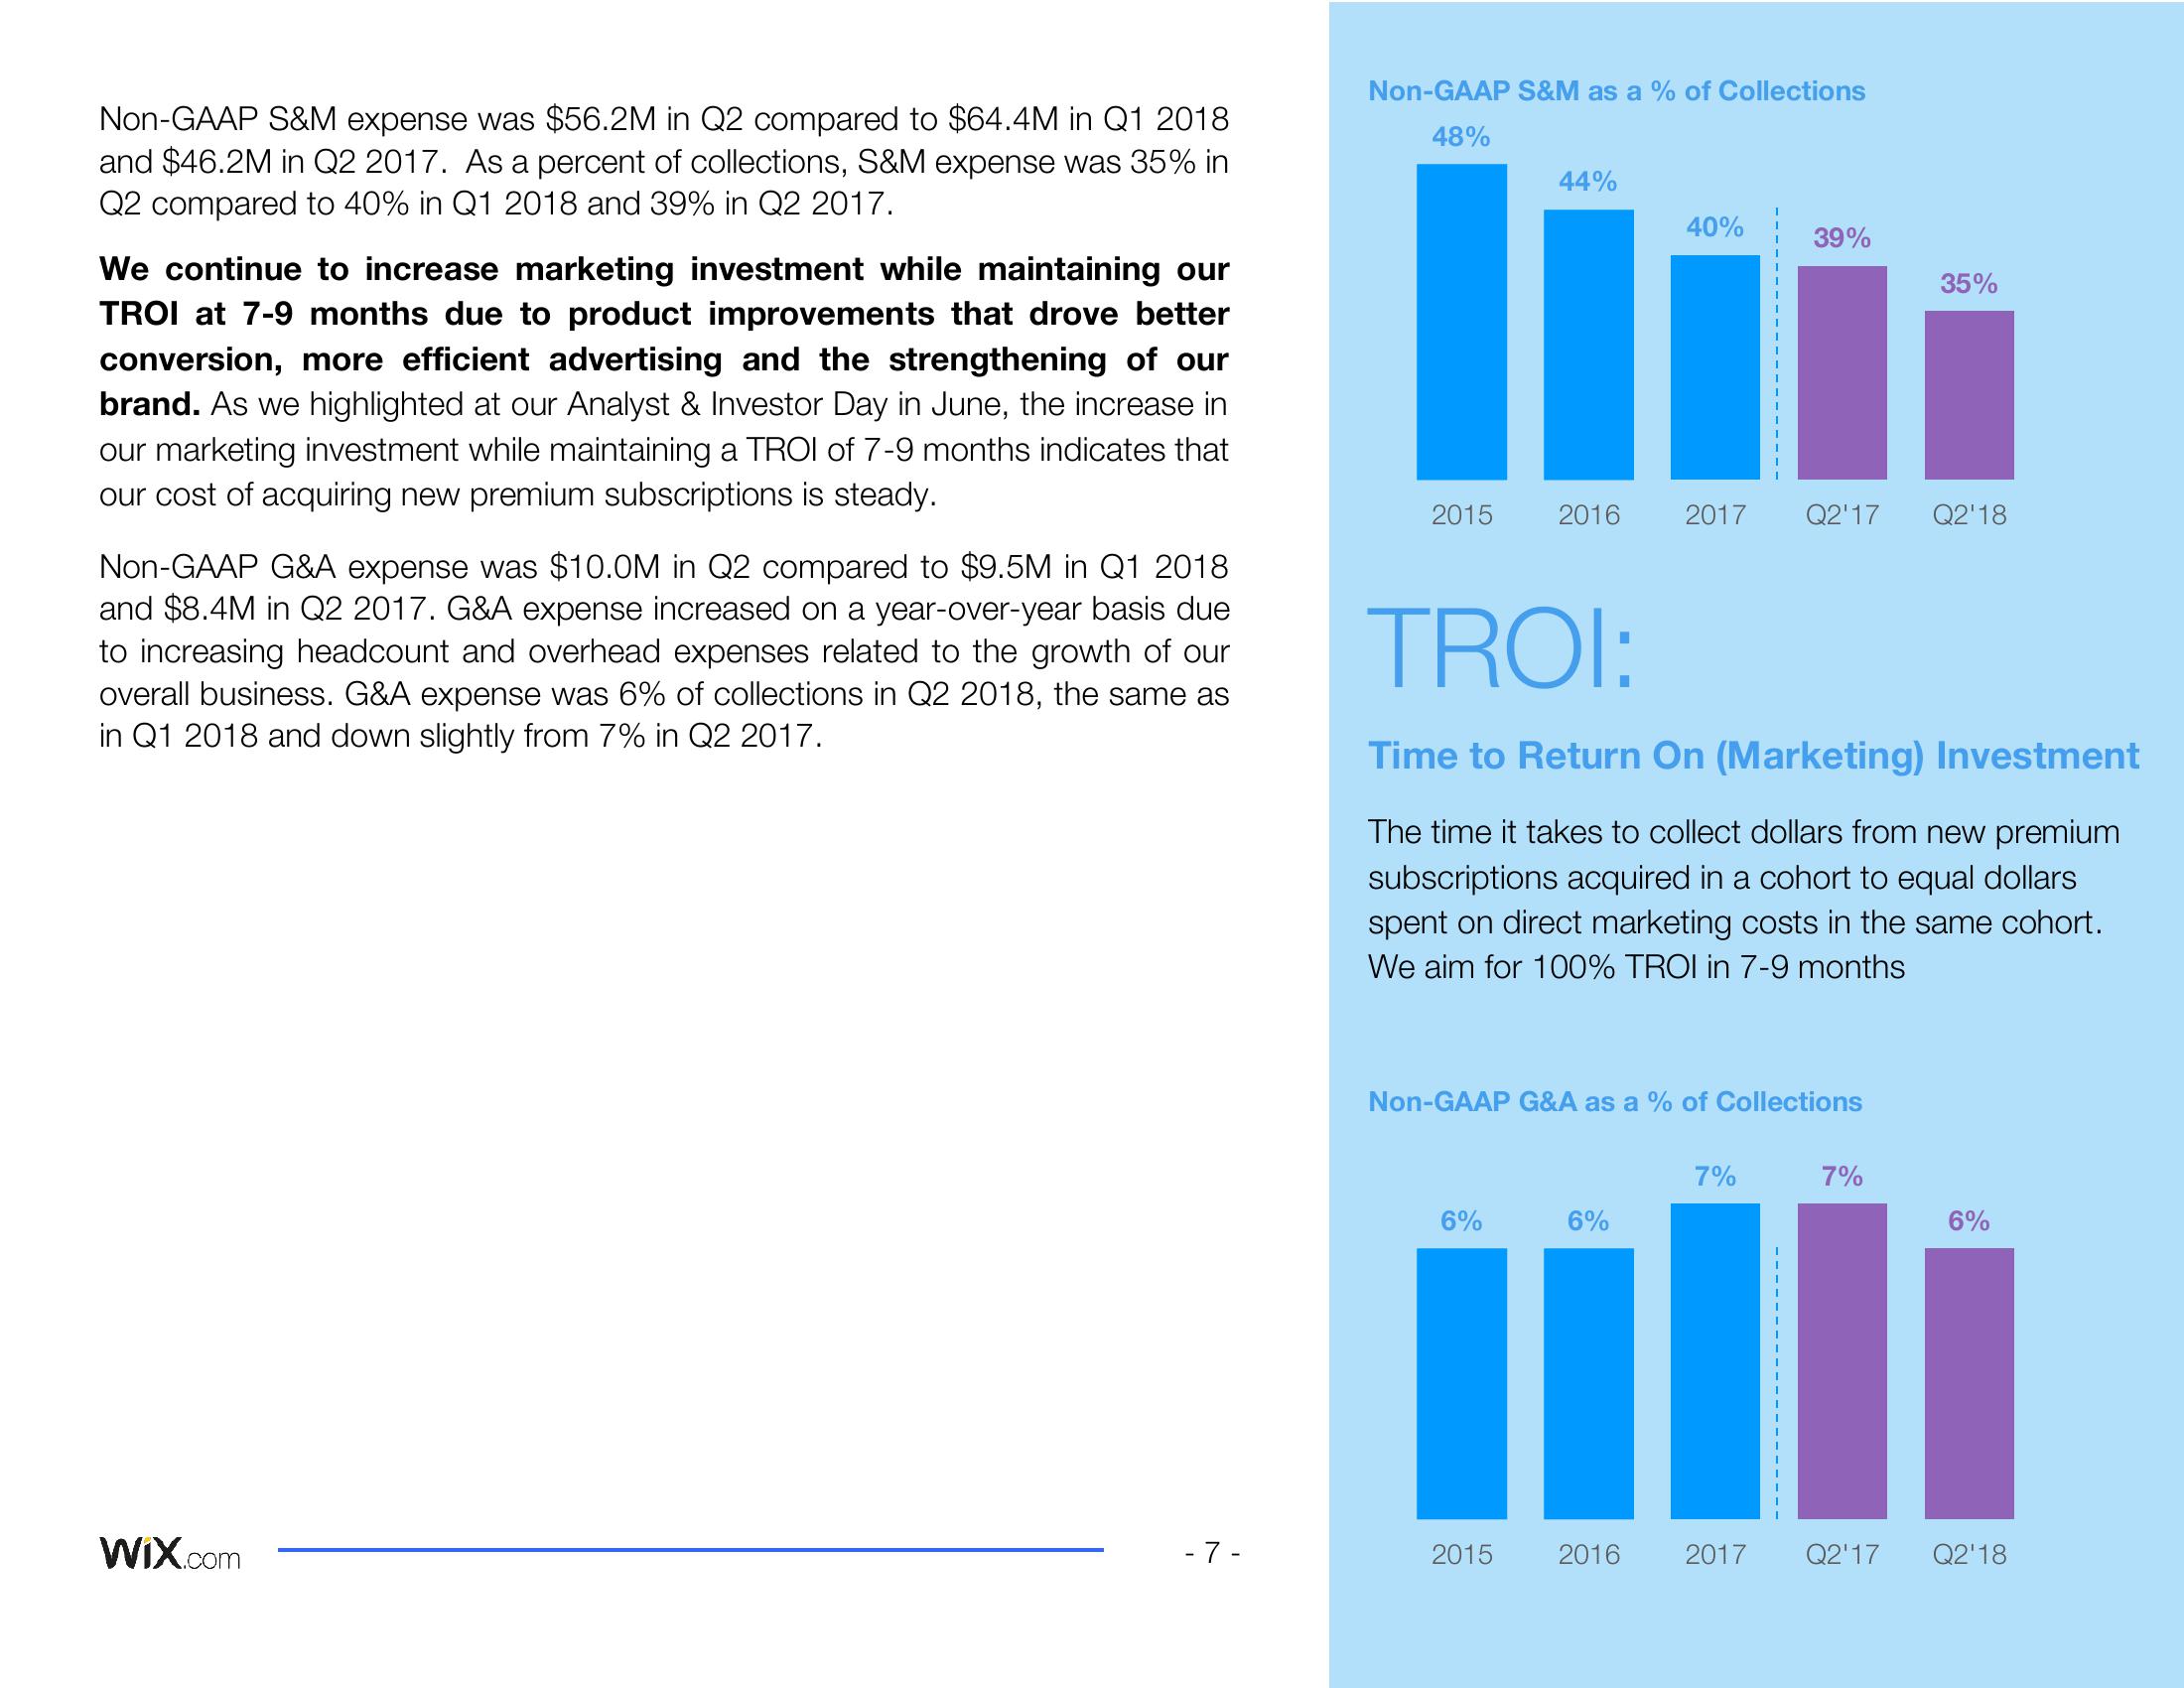
Non-GAAP S&M expense was $56.2M in Q2 compared to $64.4M in Q1 2018
and $46.2M in Q2 2017. As a percent of collections, S&M expense was 35% in
Q2 compared to 40% in Q1 2018 and 39% in Q2 2017.
We continue to increase marketing investment while maintaining our
TROI at 7-9 months due to product improvements that drove better
conversion, more efficient advertising and the strengthening of our
brand. As we highlighted at our Analyst & Investor Day in June, the increase in
our marketing investment while maintaining a TROI of 7-9 months indicates that
our cost of acquiring new premium subscriptions is steady.
Non-GAAP G&A expense was $10.0M in Q2 compared to $9.5M in Q1 2018
and $8.4M in Q2 2017. G&A expense increased on a year-over-year basis due
to increasing headcount and overhead expenses related to the growth of our
overall business. G&A expense was 6% of collections in Q2 2018, the same as
in Q1 2018 and down slightly from 7% in Q2 2017.
Wix.com
-7-
Non-GAAP S&M as a % of Collections
48%
2015
44%
2016
6%
2015
40%
39%
TROI:
Time to Return On (Marketing) Investment
The time it takes to collect dollars from new premium
subscriptions acquired in a cohort to equal dollars
spent on direct marketing costs in the same cohort.
We aim for 100% TROI in 7-9 months
Non-GAAP G&A as a % of Collections
2016
2017 Q2'17 Q2'18
35%
7%
6%
milli
2017 Q2'17 Q2'18
7%
6%View entire presentation