Dutch Bros Results Presentation Deck
INCOME STATEMENT
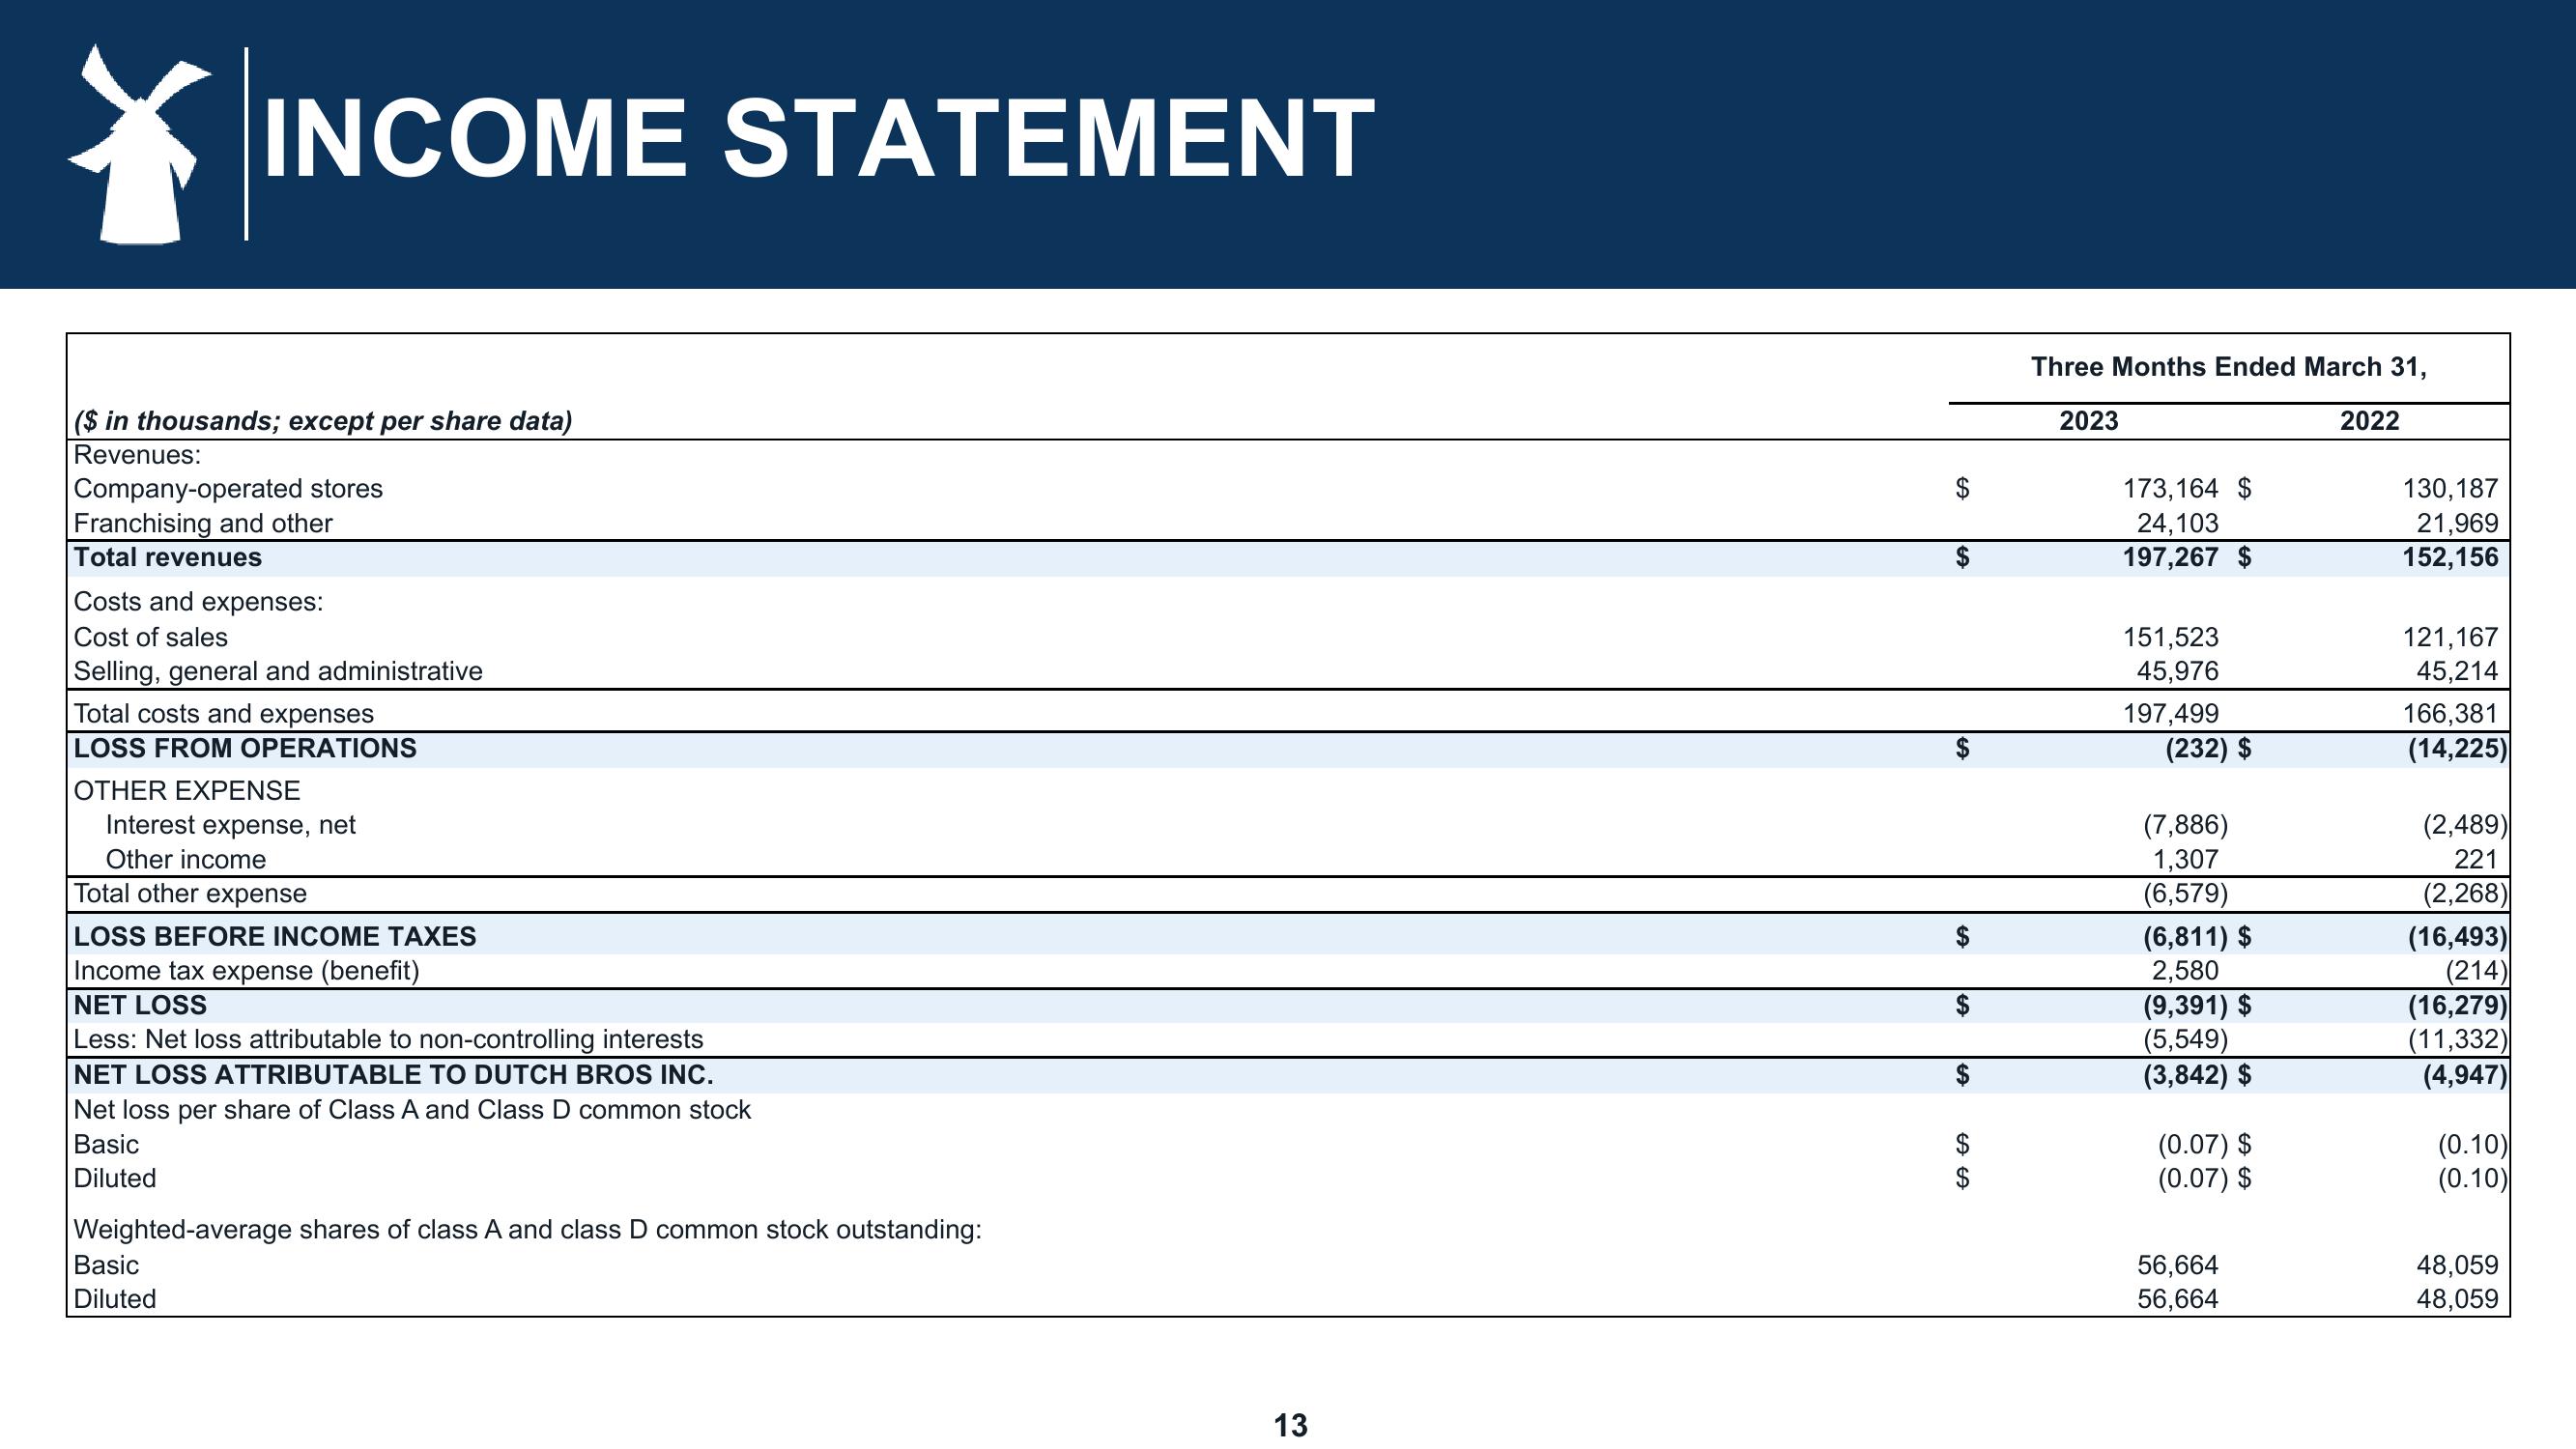
($ in thousands; except per share data)
Revenues:
Company-operated stores
Franchising and other
Total revenues
Costs and expenses:
Cost of sales
Selling, general and administrative
Total costs and expenses
LOSS FROM OPERATIONS
OTHER EXPENSE
Interest expense, net
Other income
Total other expense
LOSS BEFORE INCOME TAXES
Income tax expense (benefit)
NET LOSS
Less: Net loss attributable to non-controlling interests
NET LOSS ATTRIBUTABLE TO DUTCH BROS INC.
Net loss per share of Class A and Class D common stock
Basic
Diluted
Weighted-average shares of class A and class D common stock outstanding:
Basic
Diluted
13
SA
SA
SA
LA CA
Three Months Ended March 31,
2023
173,164 $
24,103
197,267 $
151,523
45,976
197,499
(232) $
(7,886)
1,307
(6,579)
(6,811) $
2,580
(9,391) $
(5,549)
(3,842) $
(0.07) $
(0.07) $
56,664
56,664
2022
130,187
21,969
152,156
121,167
45,214
166,381
(14,225)
(2,489)
221
(2,268)
(16,493)
(214)
(16,279)
(11,332)
(4,947)
(0.10)
(0.10)
48,059
48,059View entire presentation