Comcast Results Presentation Deck
Cable Communications 3rd Quarter 2020 Overview
Customer Relationships (M) Revenue
Per CR*
31.2
Adjusted EBITDA
7
3Q 19
$5.8
$62.34
3Q 19
+5.8%
+4.9%
32.7
3Q20
+10.5%
$6.4
$65.94
3Q20
$14.6
3Q 19
($B) Net Cash Flow
$3.7
3Q 19
+2.9%
$15.0
3Q20
+19.1%
$4.3
3Q 20
($B)
($B)
Commentary
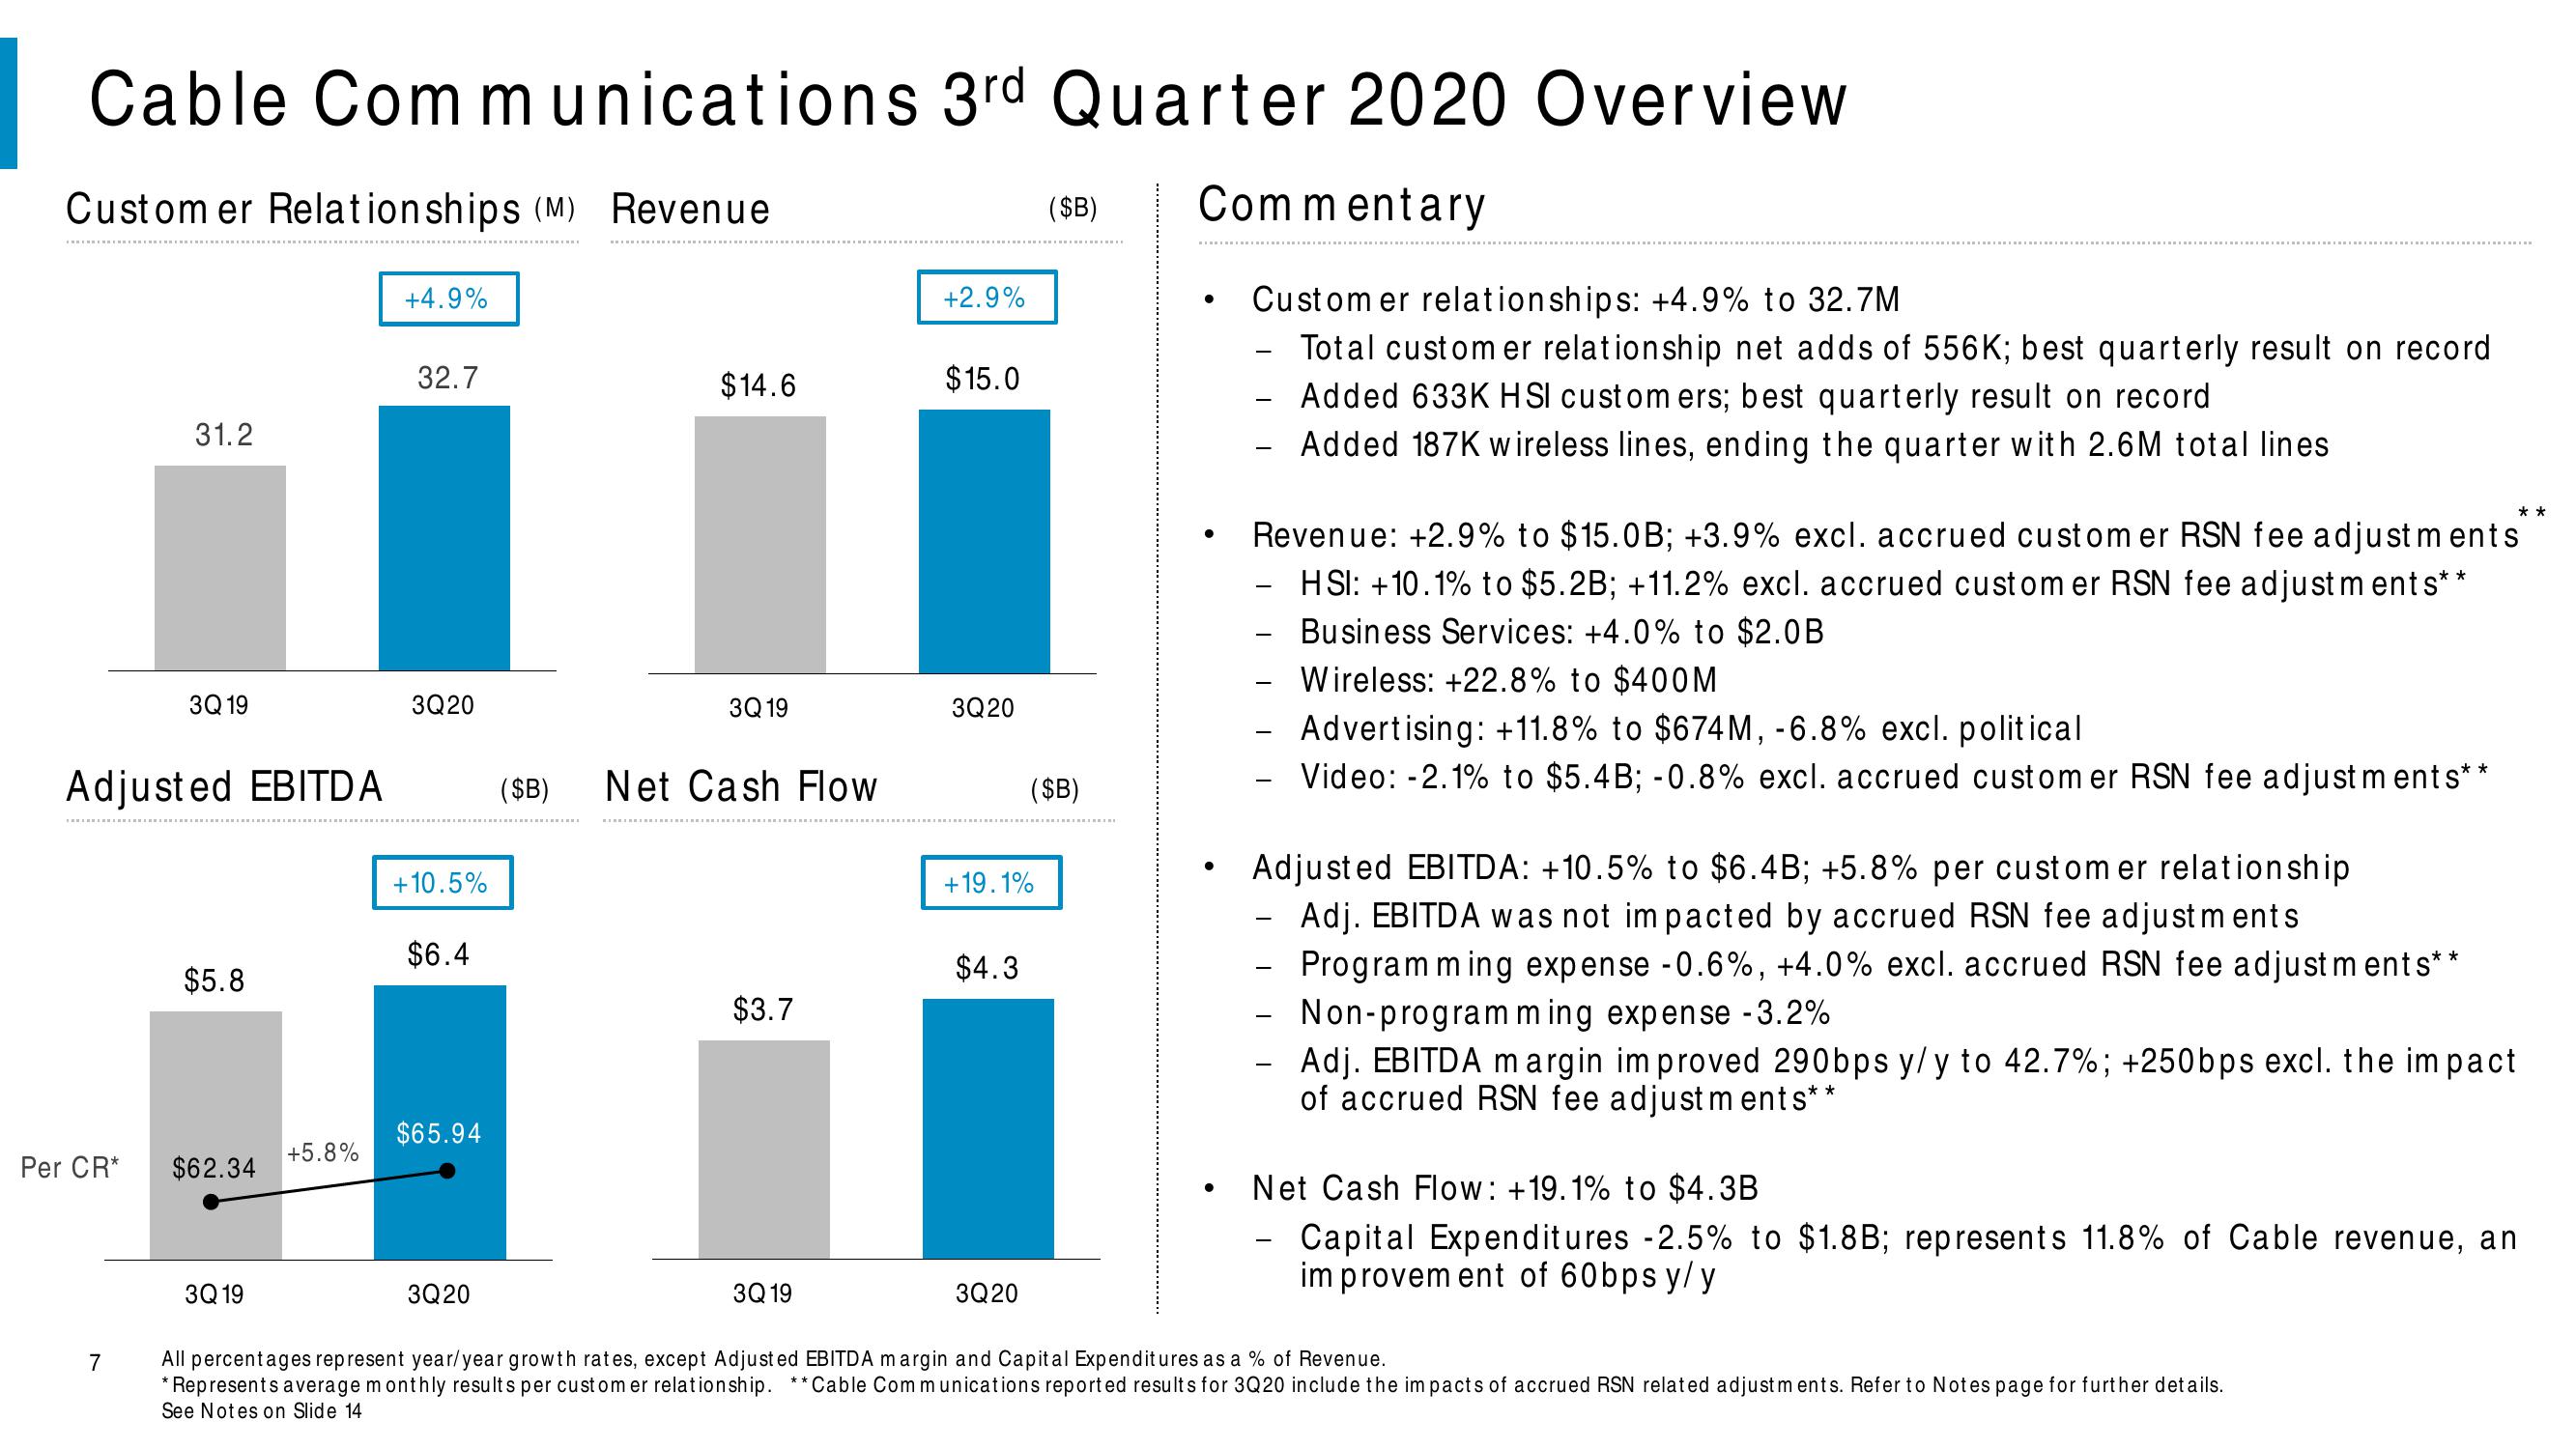
Customer relationships: +4.9% to 32.7M
Total customer relationship net adds of 556K; best quarterly result on record
Added 633K HSI customers; best quarterly result on record
Added 187K wireless lines, ending the quarter with 2.6M total lines
●
●
●
-
Revenue: +2.9% to $15.0B; +3.9% excl. accrued customer RSN fee adjustments
HSI: +10.1% to $5.2B; +11.2% excl. accrued custom er RSN fee adjustments**
Business Services: +4.0% to $2.0B
Wireless: +22.8% to $400M
-
Advertising: +11.8% to $674M, -6.8% excl. political
Video: -2.1% to $5.4B; -0.8% excl. accrued customer RSN fee adjustments**
**
Adjusted EBITDA: +10.5% to $6.4B; +5.8% per customer relationship
Adj. EBITDA was not impacted by accrued RSN fee adjustments
Programming expense -0.6%, +4.0% excl. accrued RSN fee adjustments**
Non-programming expense -3.2%
Adj. EBITDA margin improved 290bps y/y to 42.7%; +250bps excl. the impact
of accrued RSN fee adjustments*
*
Net Cash Flow: +19.1% to $4.3B
Capital Expenditures -2.5% to $1.8B; represents 11.8% of Cable revenue, an
improvement of 60bps y/y
All percentages represent year/year growth rates, except Adjusted EBITDA margin and Capital Expenditures as a % of Revenue.
*Represents average monthly results per customer relationship. ** Cable Communications reported results for 3Q20 include the impacts of accrued RSN related adjustments. Refer to Notes page for further details.
See Notes on Slide 14.View entire presentation