Kin SPAC Presentation Deck
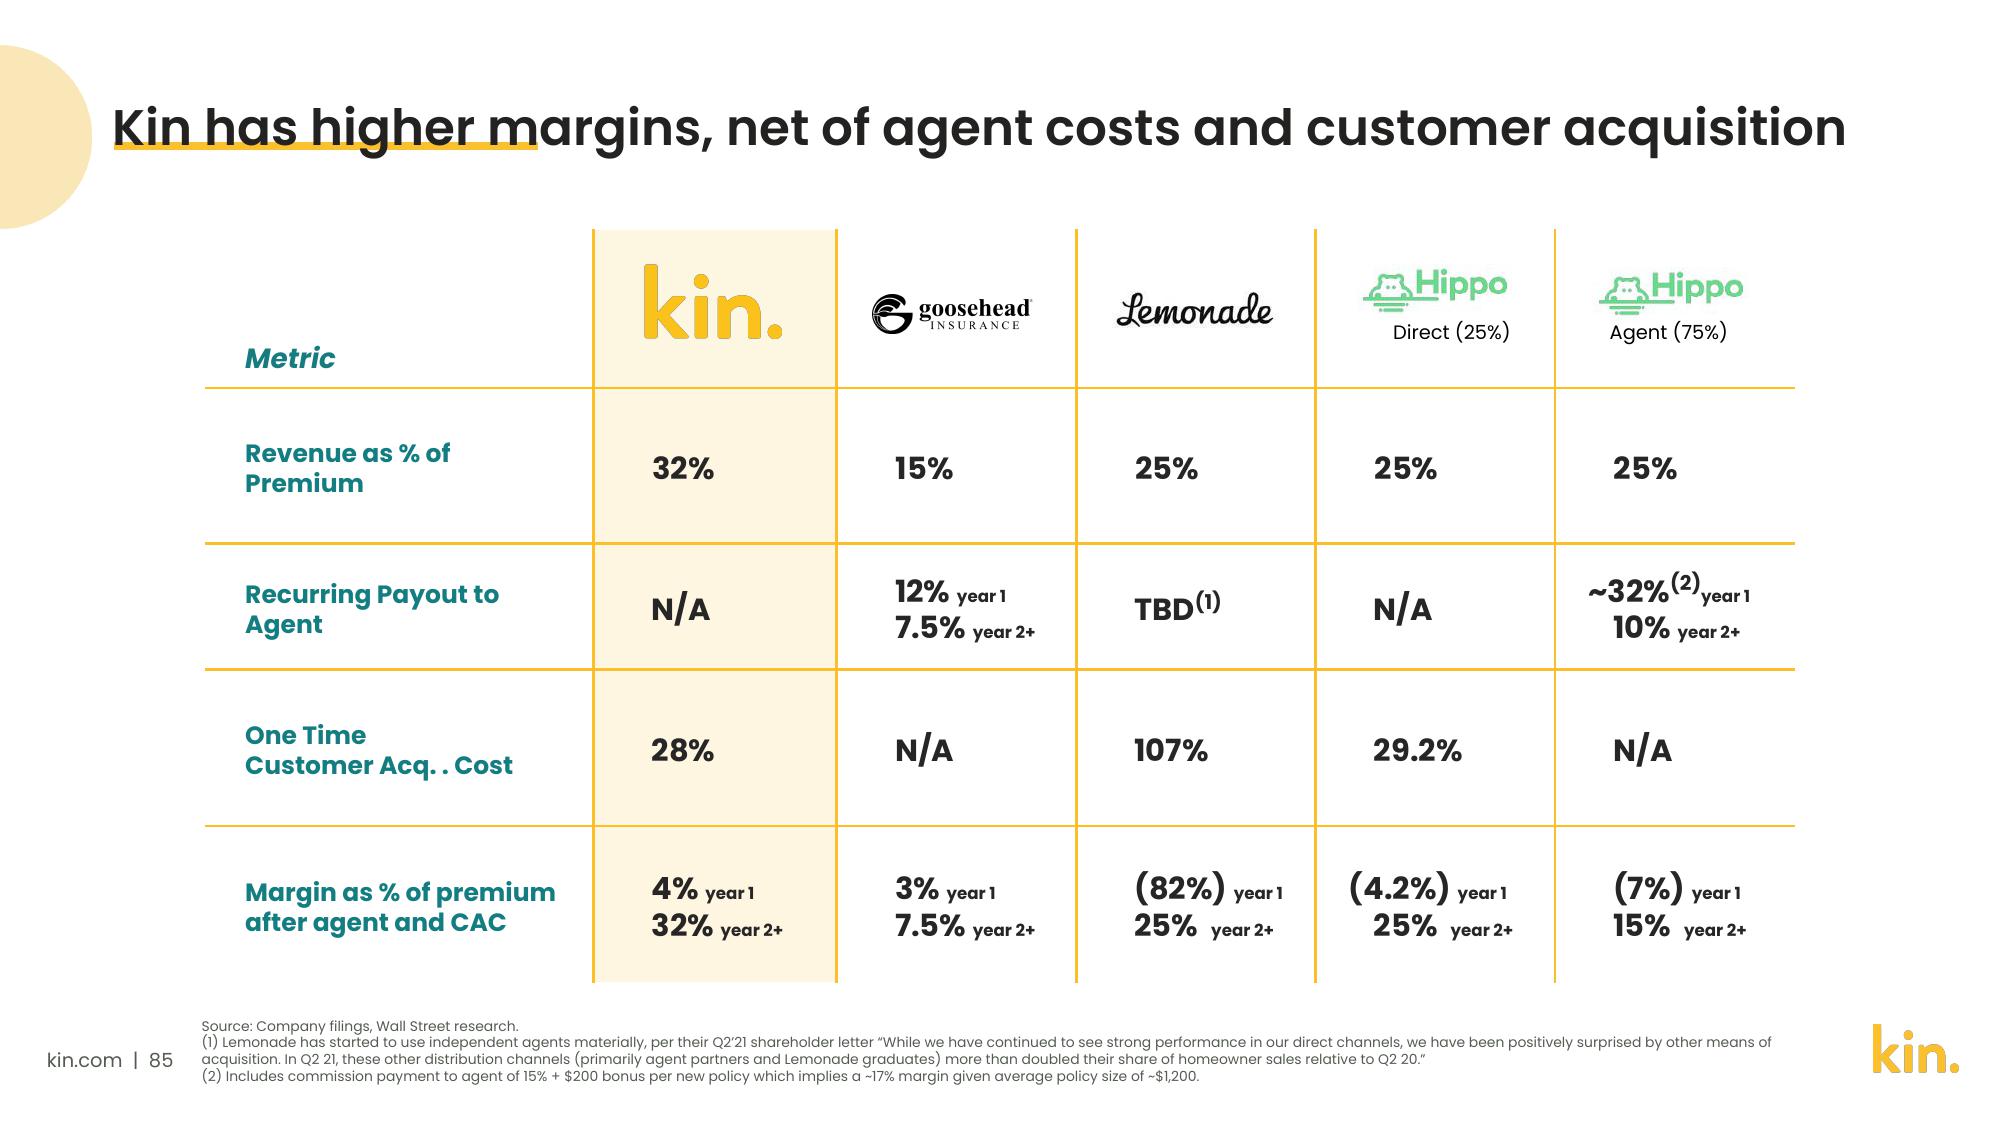
Kin has higher margins, net of agent costs and customer acquisition
kin.com | 85
Metric
Revenue as % of
Premium
Recurring Payout to
Agent
One Time
Customer Acq.. Cost
Margin as % of premium
after agent and CAC
kin.
32%
N/A
28%
4%
32%
year 1
year 2+
INSURANCE
15%
12% year 1
7.5%
N/A
year 2+
3% year 1
7.5%
year 2+
Lemonade
25%
TBD (1)
107%
(82%) year 1
25% year 2+
Hippo
Direct (25%)
25%
N/A
29.2%
(4.2%) year 1
25% year 2+
Hippo
Agent (75%)
25%
~32% (2)
10% year 2+
year 1
N/A
(7%) year 1
15% year 2+
Source: Company filings, Wall Street research.
(1) Lemonade has started to use independent agents materially, per their Q2'21 shareholder letter "While we have continued to see strong performance in our direct channels, we have been positively surprised by other means of
acquisition. In Q2 21, these other distribution channels (primarily agent partners and Lemonade graduates) more than doubled their share of homeowner sales relative to Q2 20."
(2) Includes commission payment to agent of 15% + $200 bonus per new policy which implies a -17% margin given average policy size of -$1,200.
kin.View entire presentation