Melrose Results Presentation Deck slide image

Melrose Results Presentation Deck

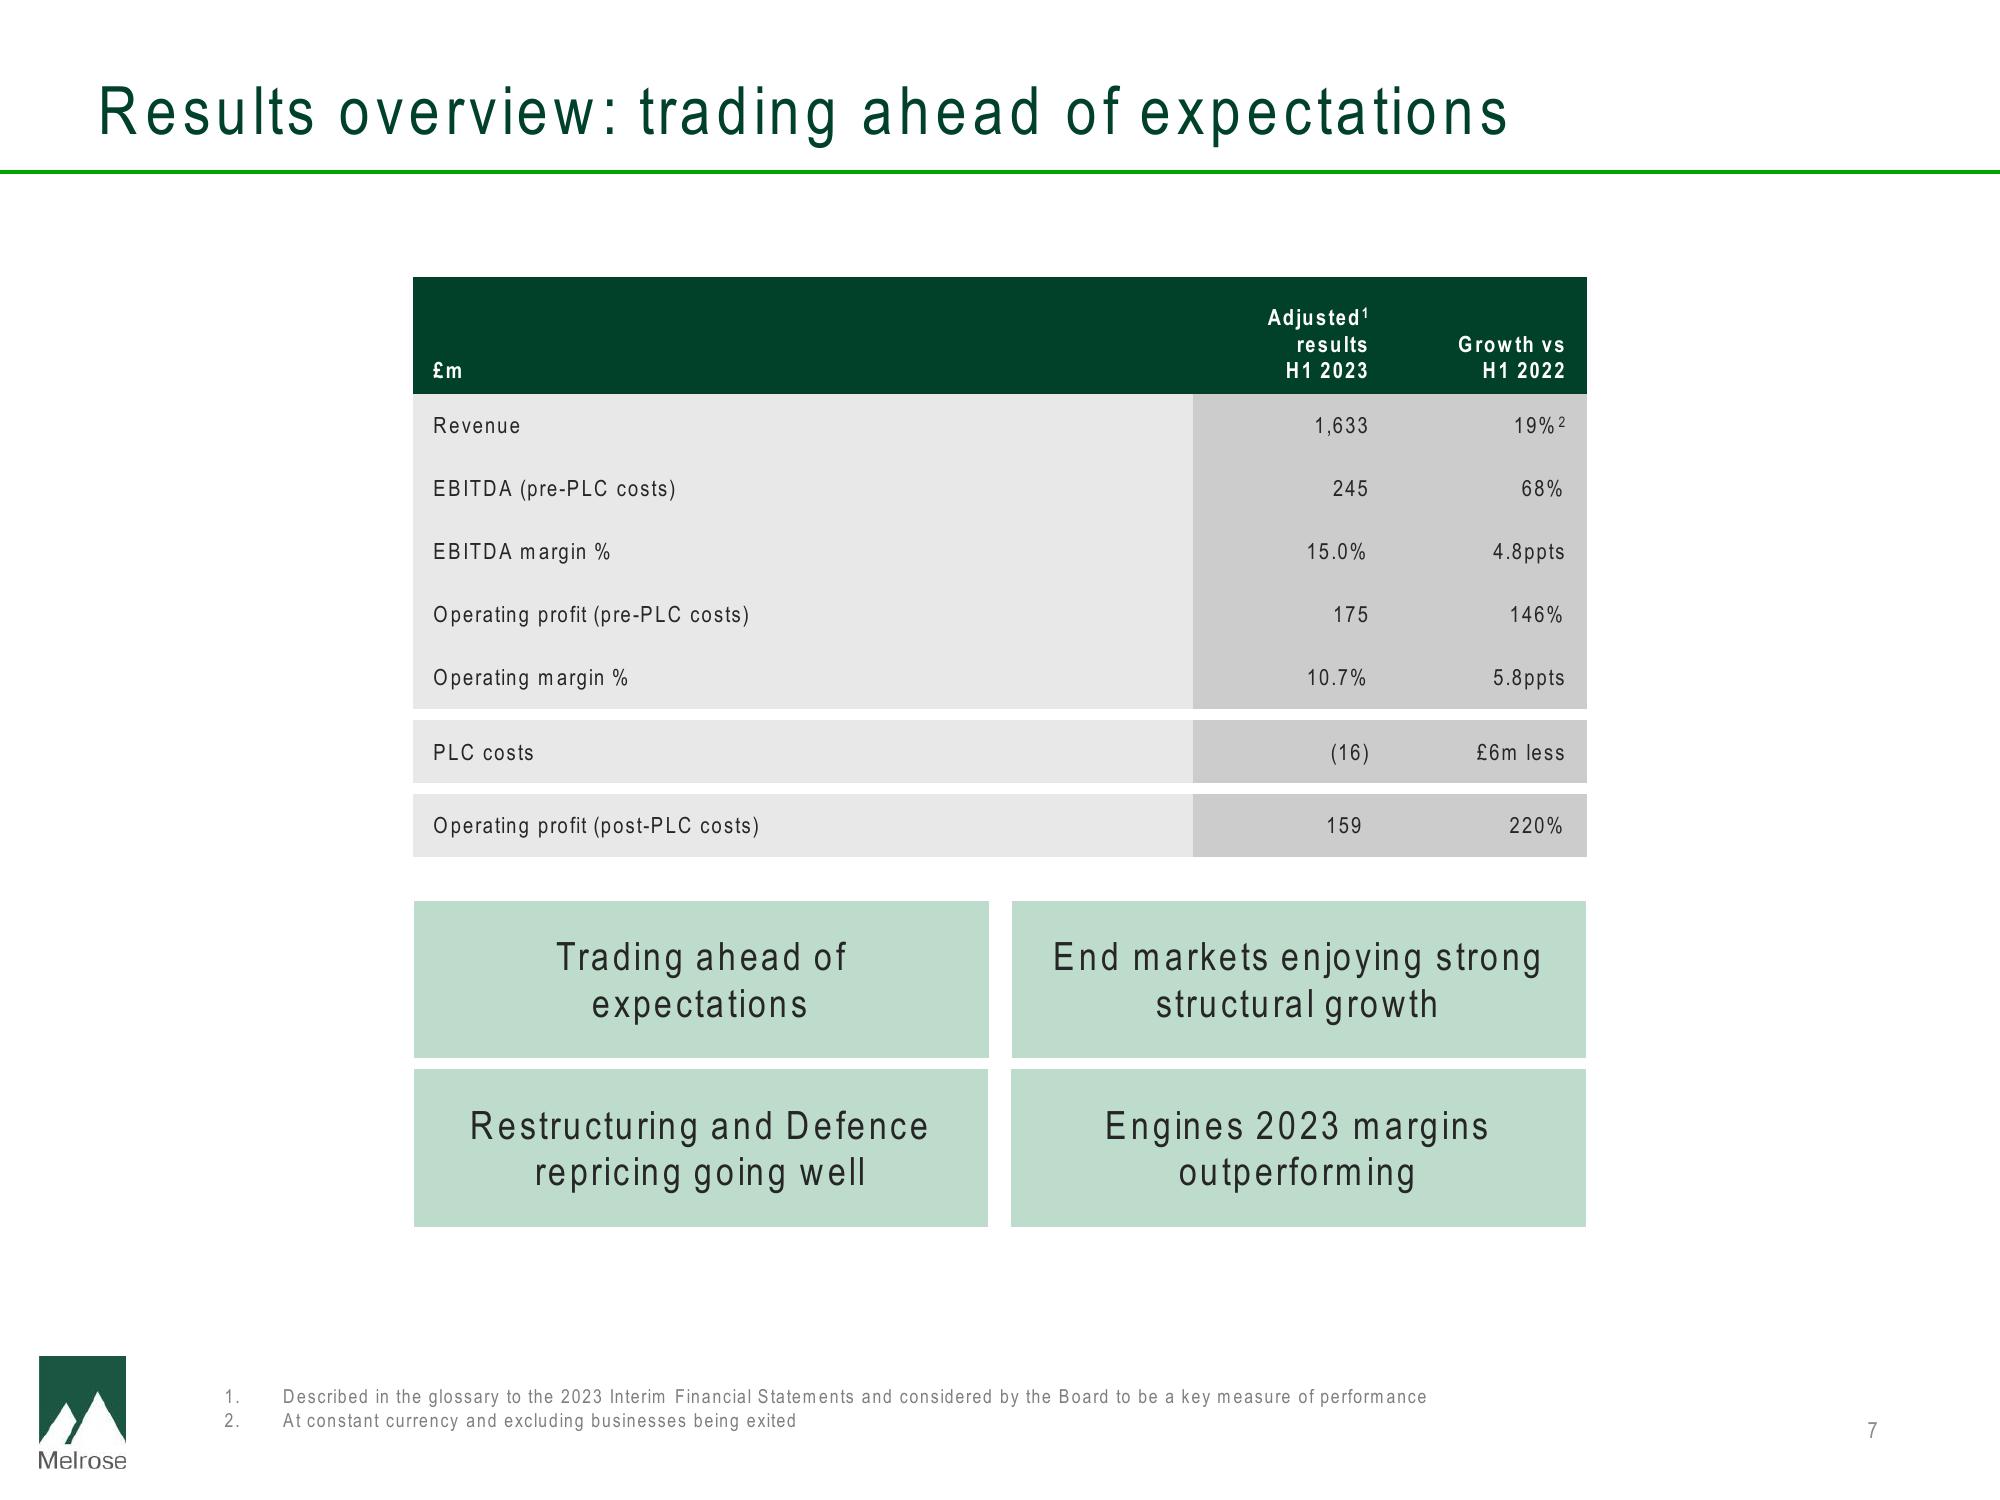
Results overview: trading ahead of expectations Melrose 1. 2. £m Revenue EBITDA (pre-PLC costs) EBITDA margin % Operating profit (pre-PLC costs) Operating margin % PLC costs Operating profit (post-PLC costs) Trading ahead of expectations Restructuring and Defence repricing going well Adjusted ¹ results H1 2023 1,633 245 15.0% 175 10.7% (16) 159 Growth vs H1 2022 Described in the glossary to the 2023 Interim Financial Statements and considered by the Board to be a key measure of performance At constant currency and excluding businesses being exited 19% 2 Engines 2023 margins outperforming 68% 4.8 ppts 146% 5.8 ppts £6m less End markets enjoying strong structural growth 220% 7
View entire presentation