Flutter Results Presentation Deck
●
●
Appendices
Australia
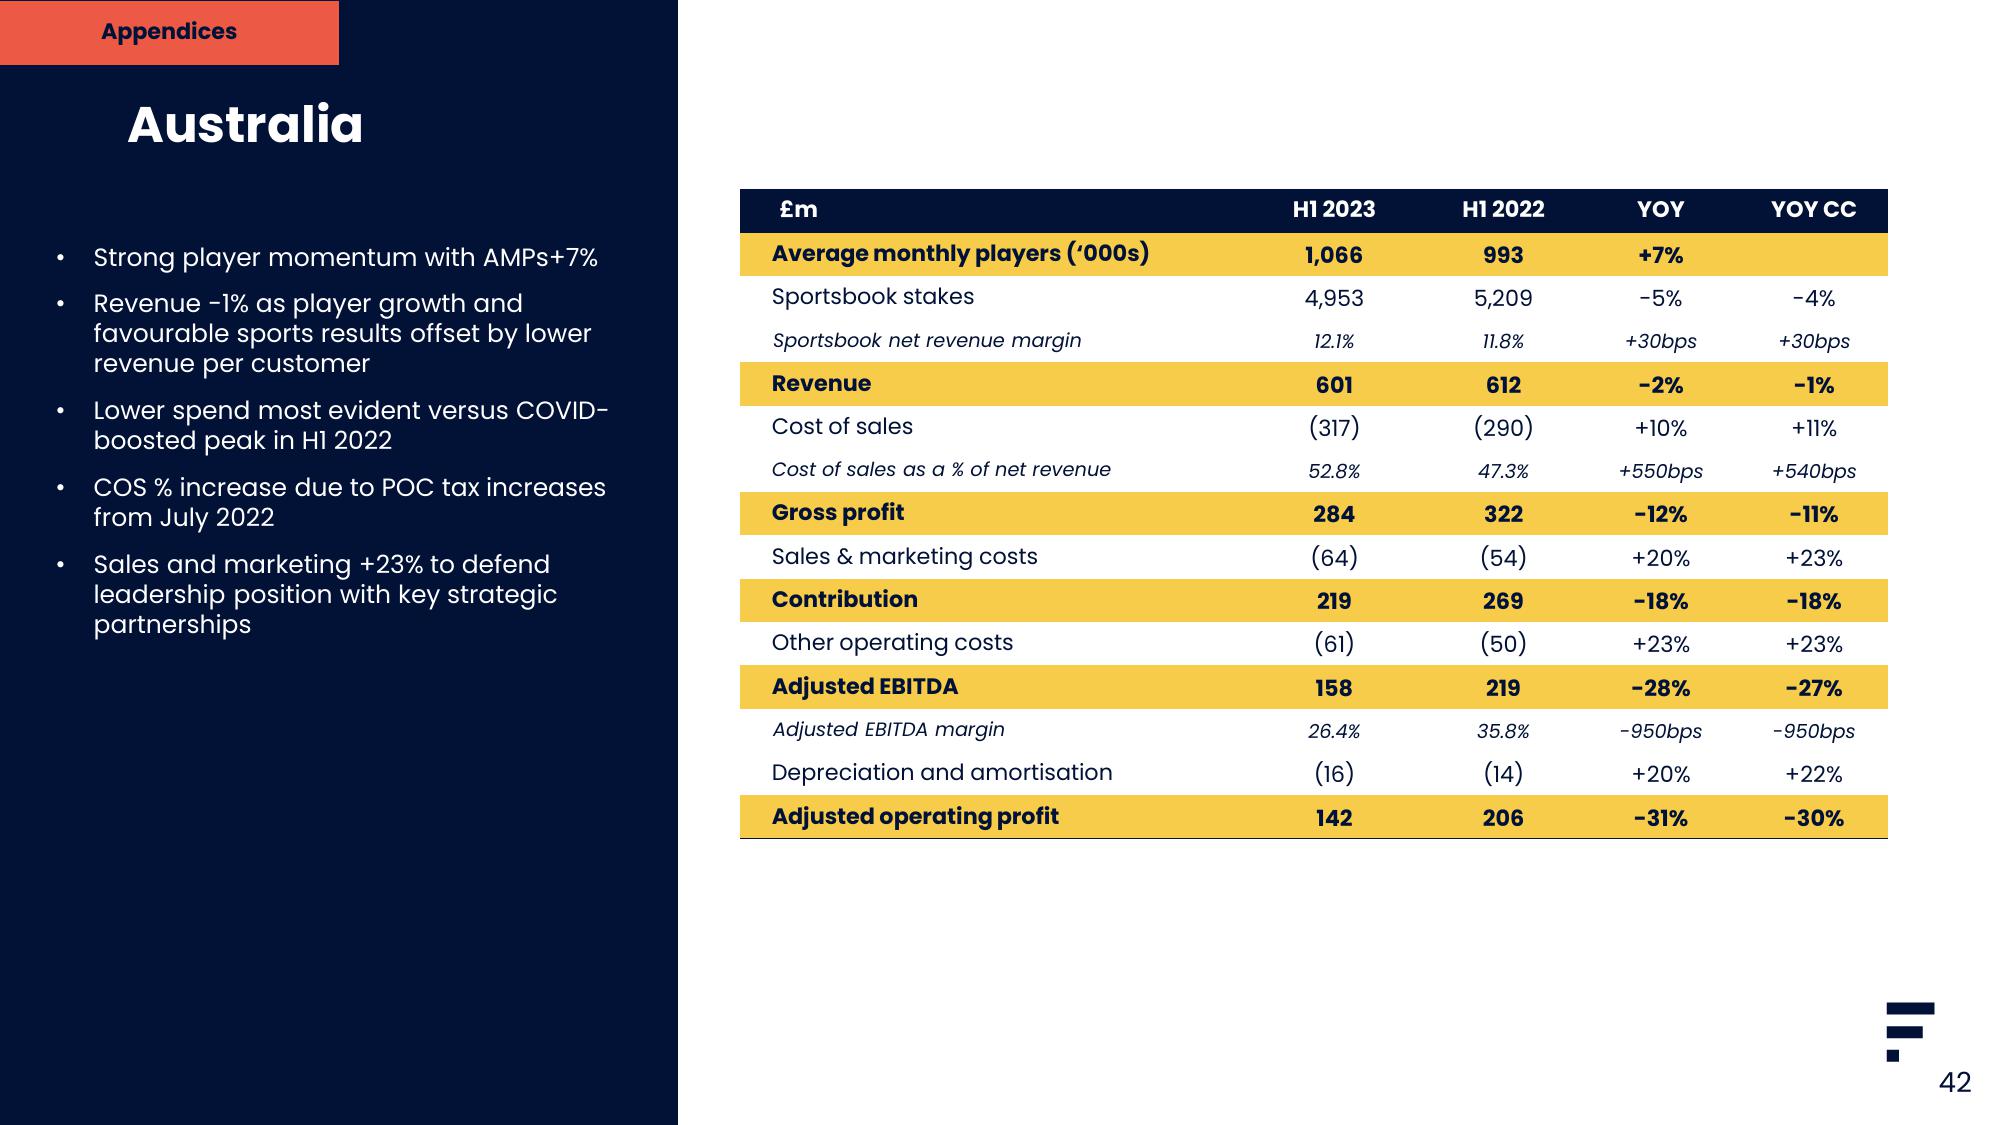
Strong player momentum with AMPS+7%
Revenue -1% as player growth and
favourable sports results offset by lower
revenue per customer
Lower spend most evident versus COVID-
boosted peak in H1 2022
COS % increase due to POC tax increases
from July 2022
Sales and marketing +23% to defend
leadership position with key strategic
partnerships
£m
Average monthly players ('000s)
Sportsbook stakes
Sportsbook net revenue margin
Revenue
Cost of sales
Cost of sales as a % of net revenue
Gross profit
Sales & marketing costs
Contribution
Other operating costs
Adjusted EBITDA
Adjusted EBITDA margin
Depreciation and amortisation
Adjusted operating profit
H1 2023
1,066
4,953
12.1%
601
(317)
52.8%
284
(64)
219
(61)
158
26.4%
(16)
142
H1 2022
993
5,209
11.8%
612
(290)
47.3%
322
(54)
269
(50)
219
35.8%
(14)
206
YOY
+7%
-5%
+30bps
-2%
+10%
+550bps
-12%
+20%
-18%
+23%
-28%
-950bps
+20%
-31%
YOY CC
-4%
+30bps
-1%
+11%
+540bps
-11%
+23%
-18%
+23%
-27%
-950bps
+22%
-30%
F
II.
42View entire presentation