Lyft Results Presentation Deck
Key Financial Metrics
($ in millions)
$1,017
Q4'19
Revenue
$500
Q3'20
$70M
$570
Q4'20
Q4'19
($131)
Adjusted EBITDA
Q3'20
Q4'20
$90M ($150)
($240)
(1)
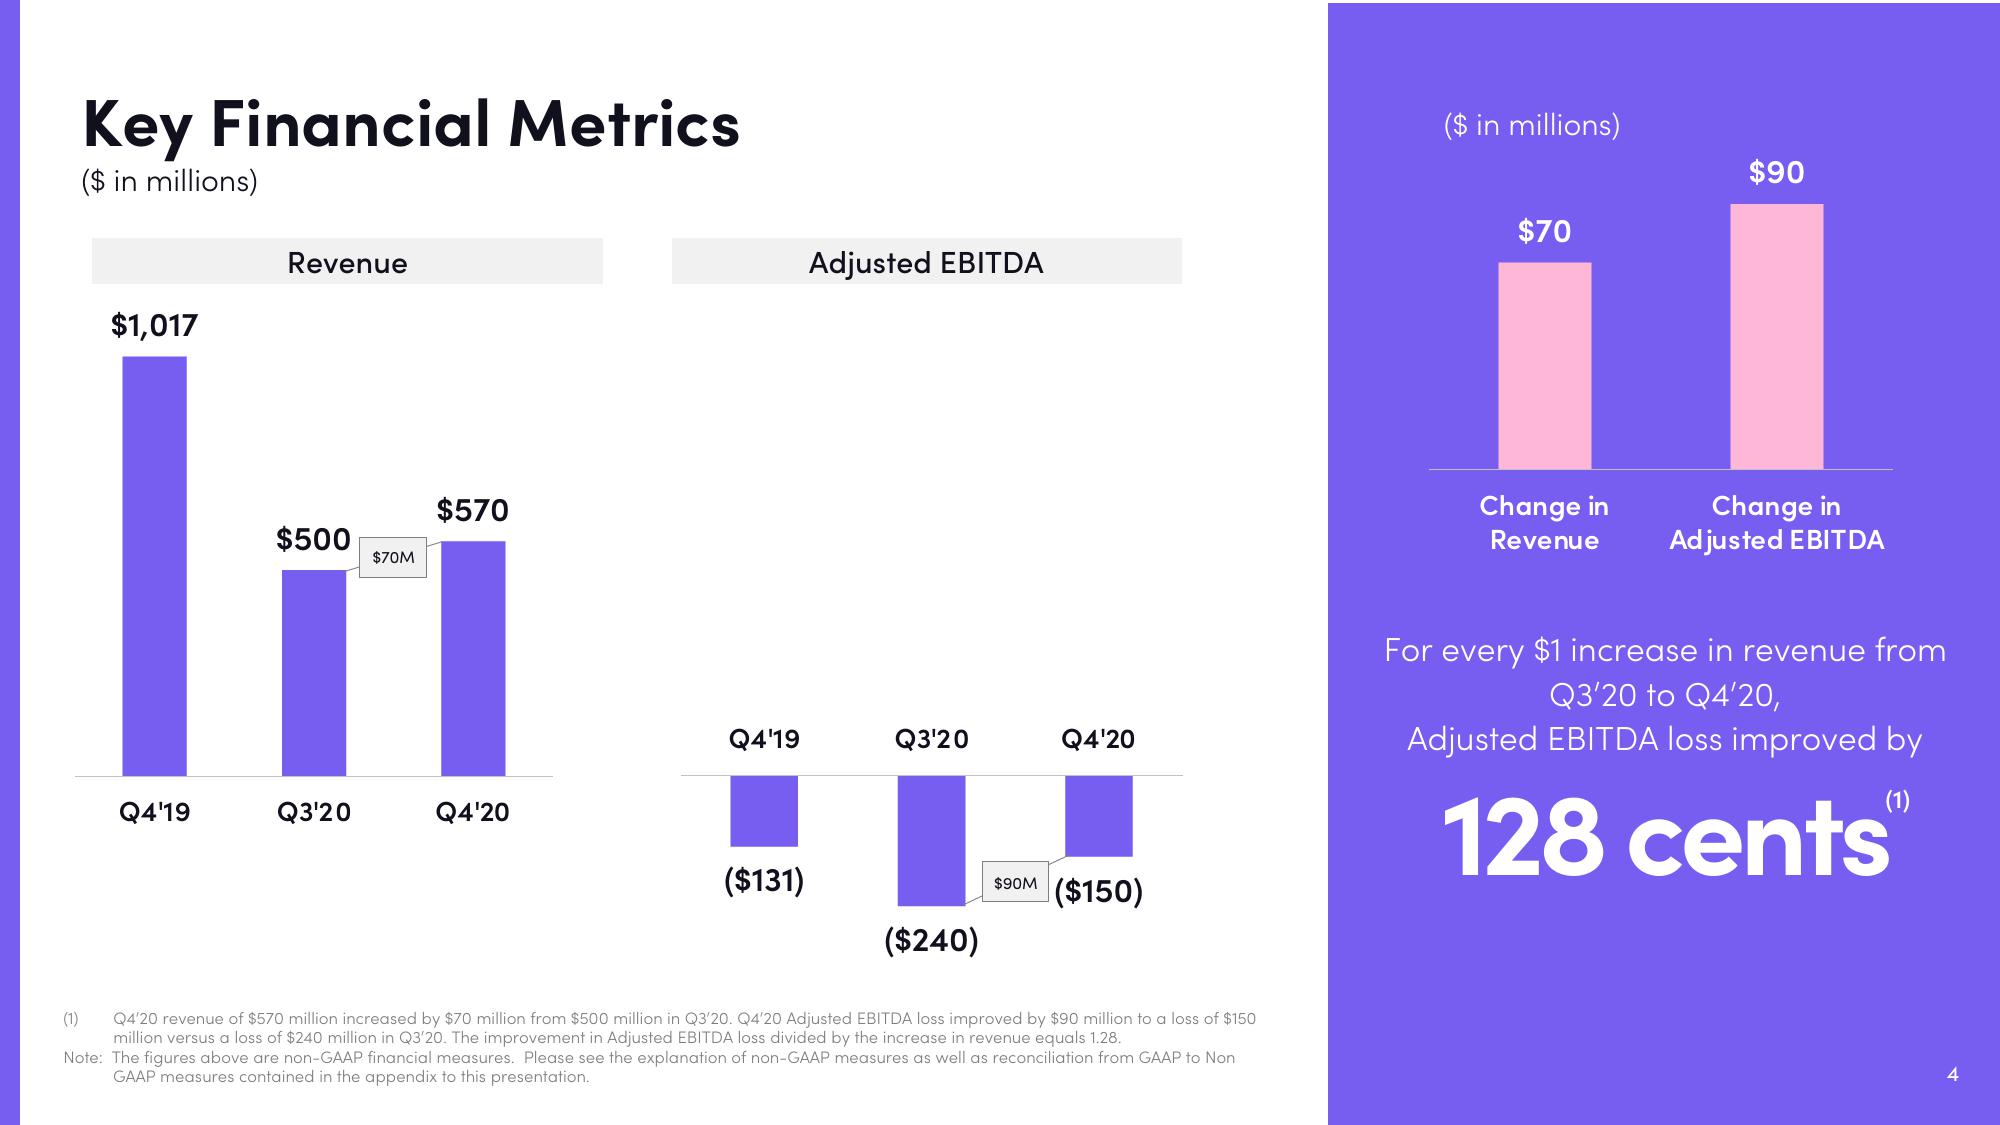
Q4'20 revenue of $570 million increased by $70 million from $500 million in Q3'20. Q4'20 Adjusted EBITDA loss improved by $90 million to a loss of $150
million versus a loss of $240 million in Q3'20. The improvement in Adjusted EBITDA loss divided by the increase in revenue equals 1.28.
Note: The figures above are non-GAAP financial measures. Please see the explanation of non-GAAP measures as well as reconciliation from GAAP to Non
GAAP measures contained in the appendix to this presentation.
($ in millions)
$70
Change in
Revenue
$90
Change in
Adjusted EBITDA
For every $1 increase in revenue from
Q3'20 to Q4'20,
Adjusted EBITDA loss improved by
(1)
128 centsView entire presentation