Comcast Results Presentation Deck
Free Cash Flow and Capital Allocation
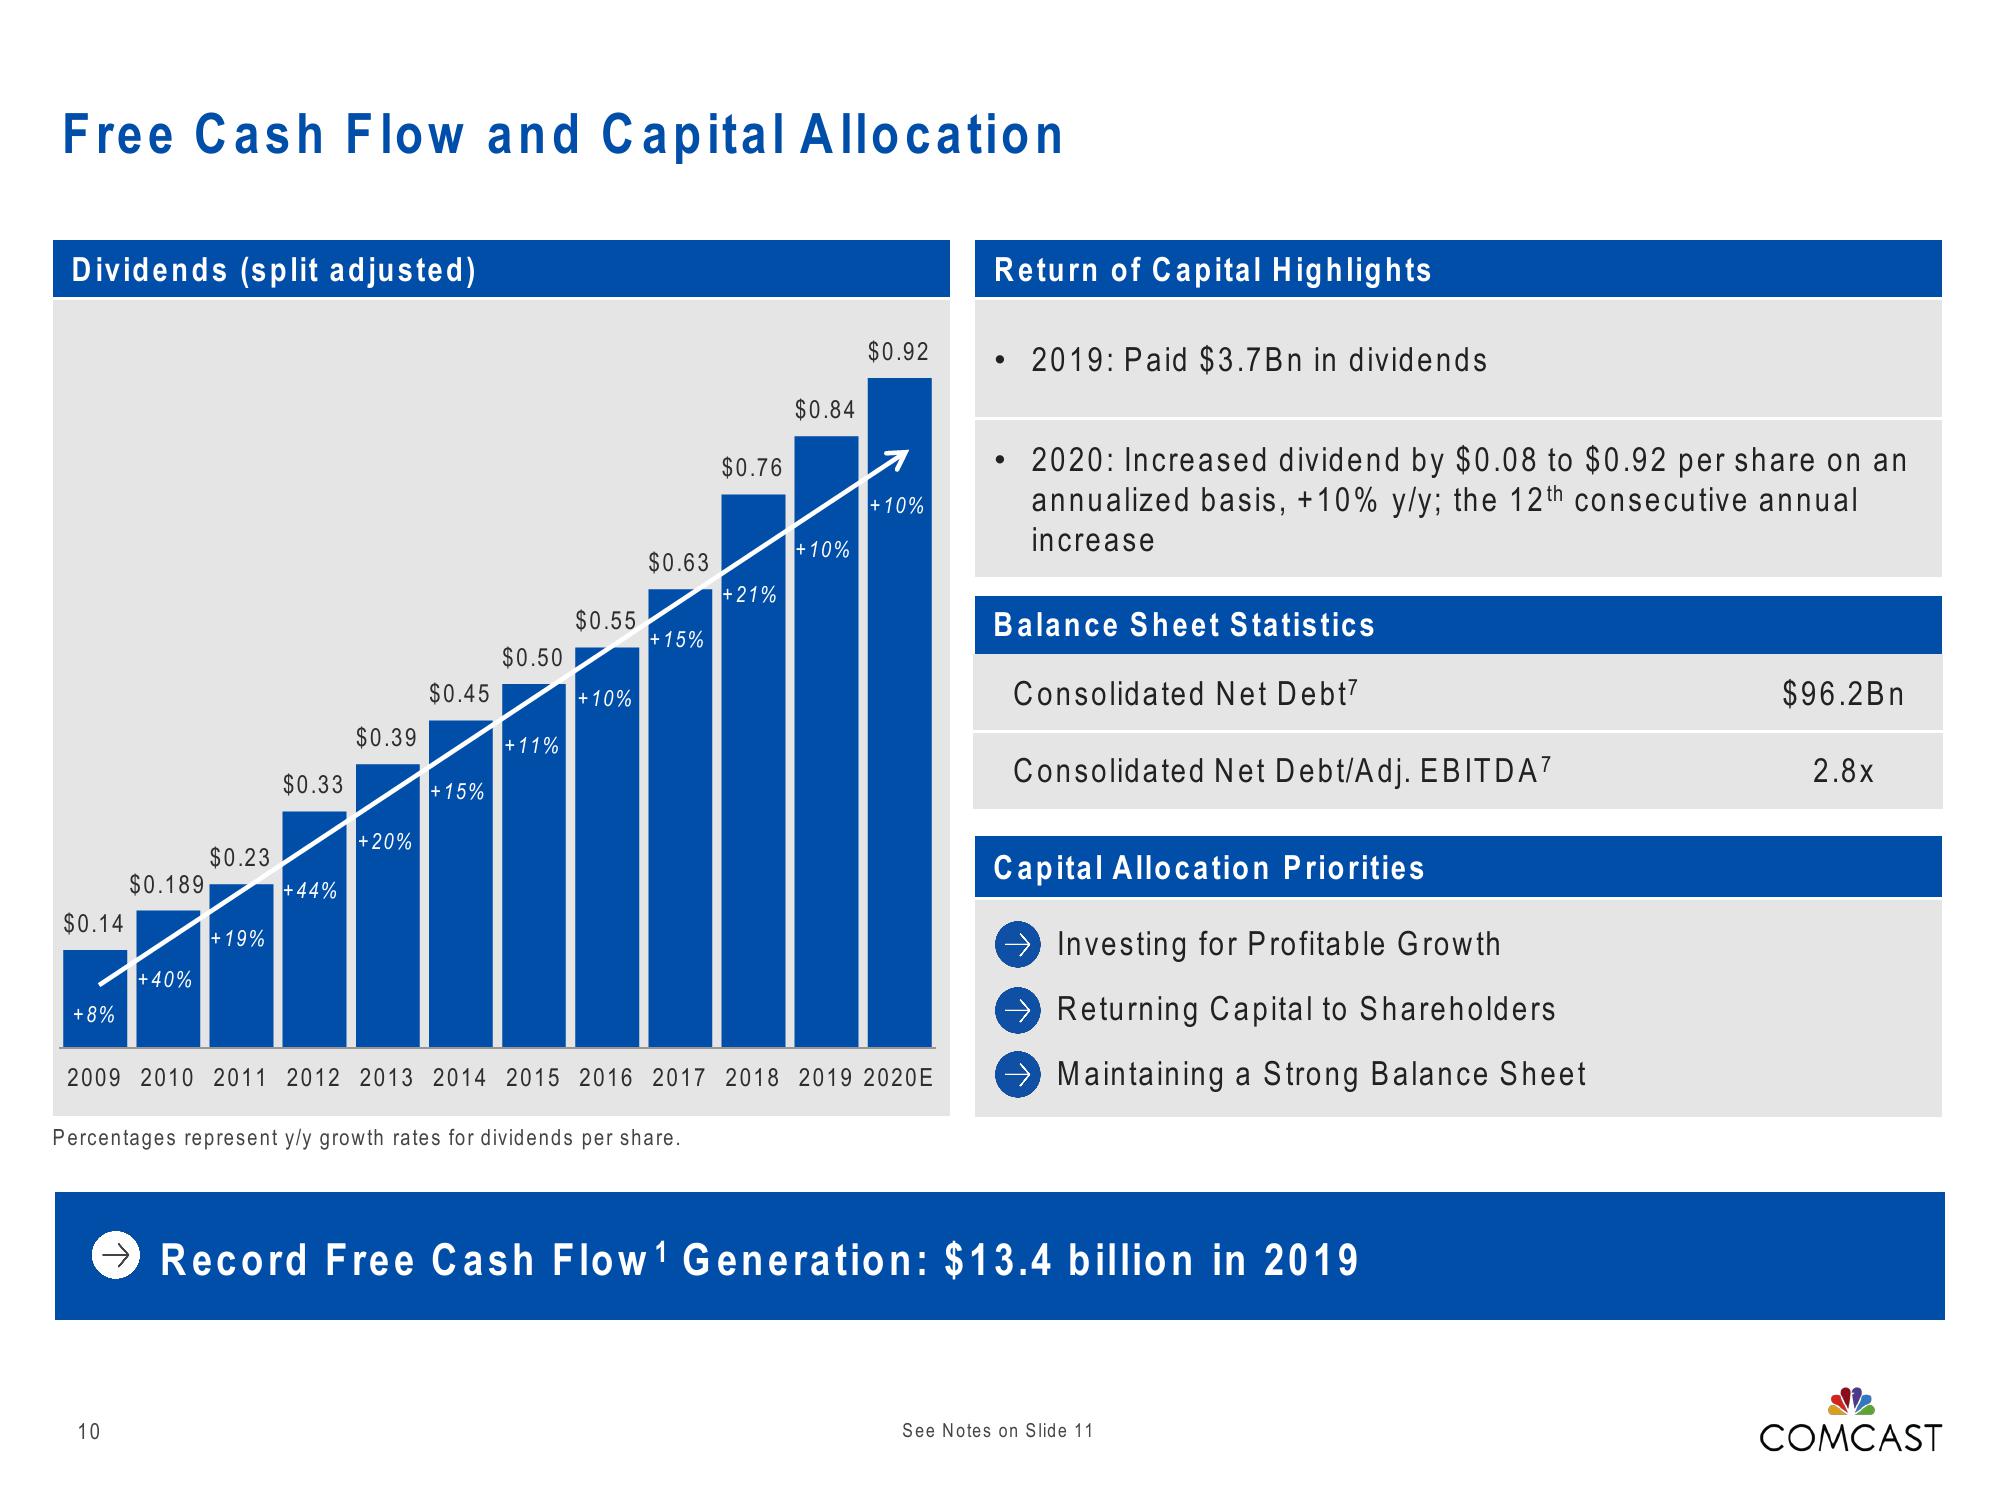
Dividends (split adjusted)
$0.14
+8%
$0.189
+40%
10
$0.23
+19%
$0.33
+44%
$0.39
+ 20%
$0.45
+15%
$0.50
+11%
$0.55
+10%
$0.63
+ 15%
Percentages represent y/y growth rates for dividends per share.
$0.76
+21%
$0.84
+10%
$0.92
2009 2010 2011 2012 2013 2014 2015 2016 2017 2018 2019 2020E
+10%
Return of Capital Highlights
●
2019: Paid $3.7Bn in dividends
• 2020: Increased dividend by $0.08 to $0.92 per share on an
annualized basis, +10% y/y; the 12th consecutive annual
increase
Balance Sheet Statistics
Consolidated Net Debt7
Consolidated Net Debt/Adj. EBITDA¹
Capital Allocation Priorities
Investing for Profitable Growth
Returning Capital to Shareholders
Maintaining a Strong Balance Sheet
Record Free Cash Flow¹ Generation: $13.4 billion in 2019
See Notes on Slide 11
$96.2Bn
2.8x
COMCASTView entire presentation