J.P.Morgan Results Presentation Deck
Corporate ¹
SELECTED INCOME STATEMENT DATA ($MM)
Revenue
Net interest income
Noninterest revenue
Expense
Credit costs
Net income/(loss)
Note: Totals may not sum due to rounding
1 See note 1 on slide 13
Reported
$1,777
2,445
JPMORGAN CHASE & CO.
(668)
3,593
(2)
($875)
4Q23
FR impact
($4)
(23)
19
231
($187)
ex. FR
$1,780
2,468
(687)
3,362
ex. FR $ 0/(U)
3Q23
$300
482
(181)
2,907
4Q22
$597
1,170
(572)
3,023
(2)
(49)
($689) ($1,600) ($1,270)
12
CCB
CIB
CB
AWM Corp.
FINANCIAL PERFORMANCE (ex. FR)
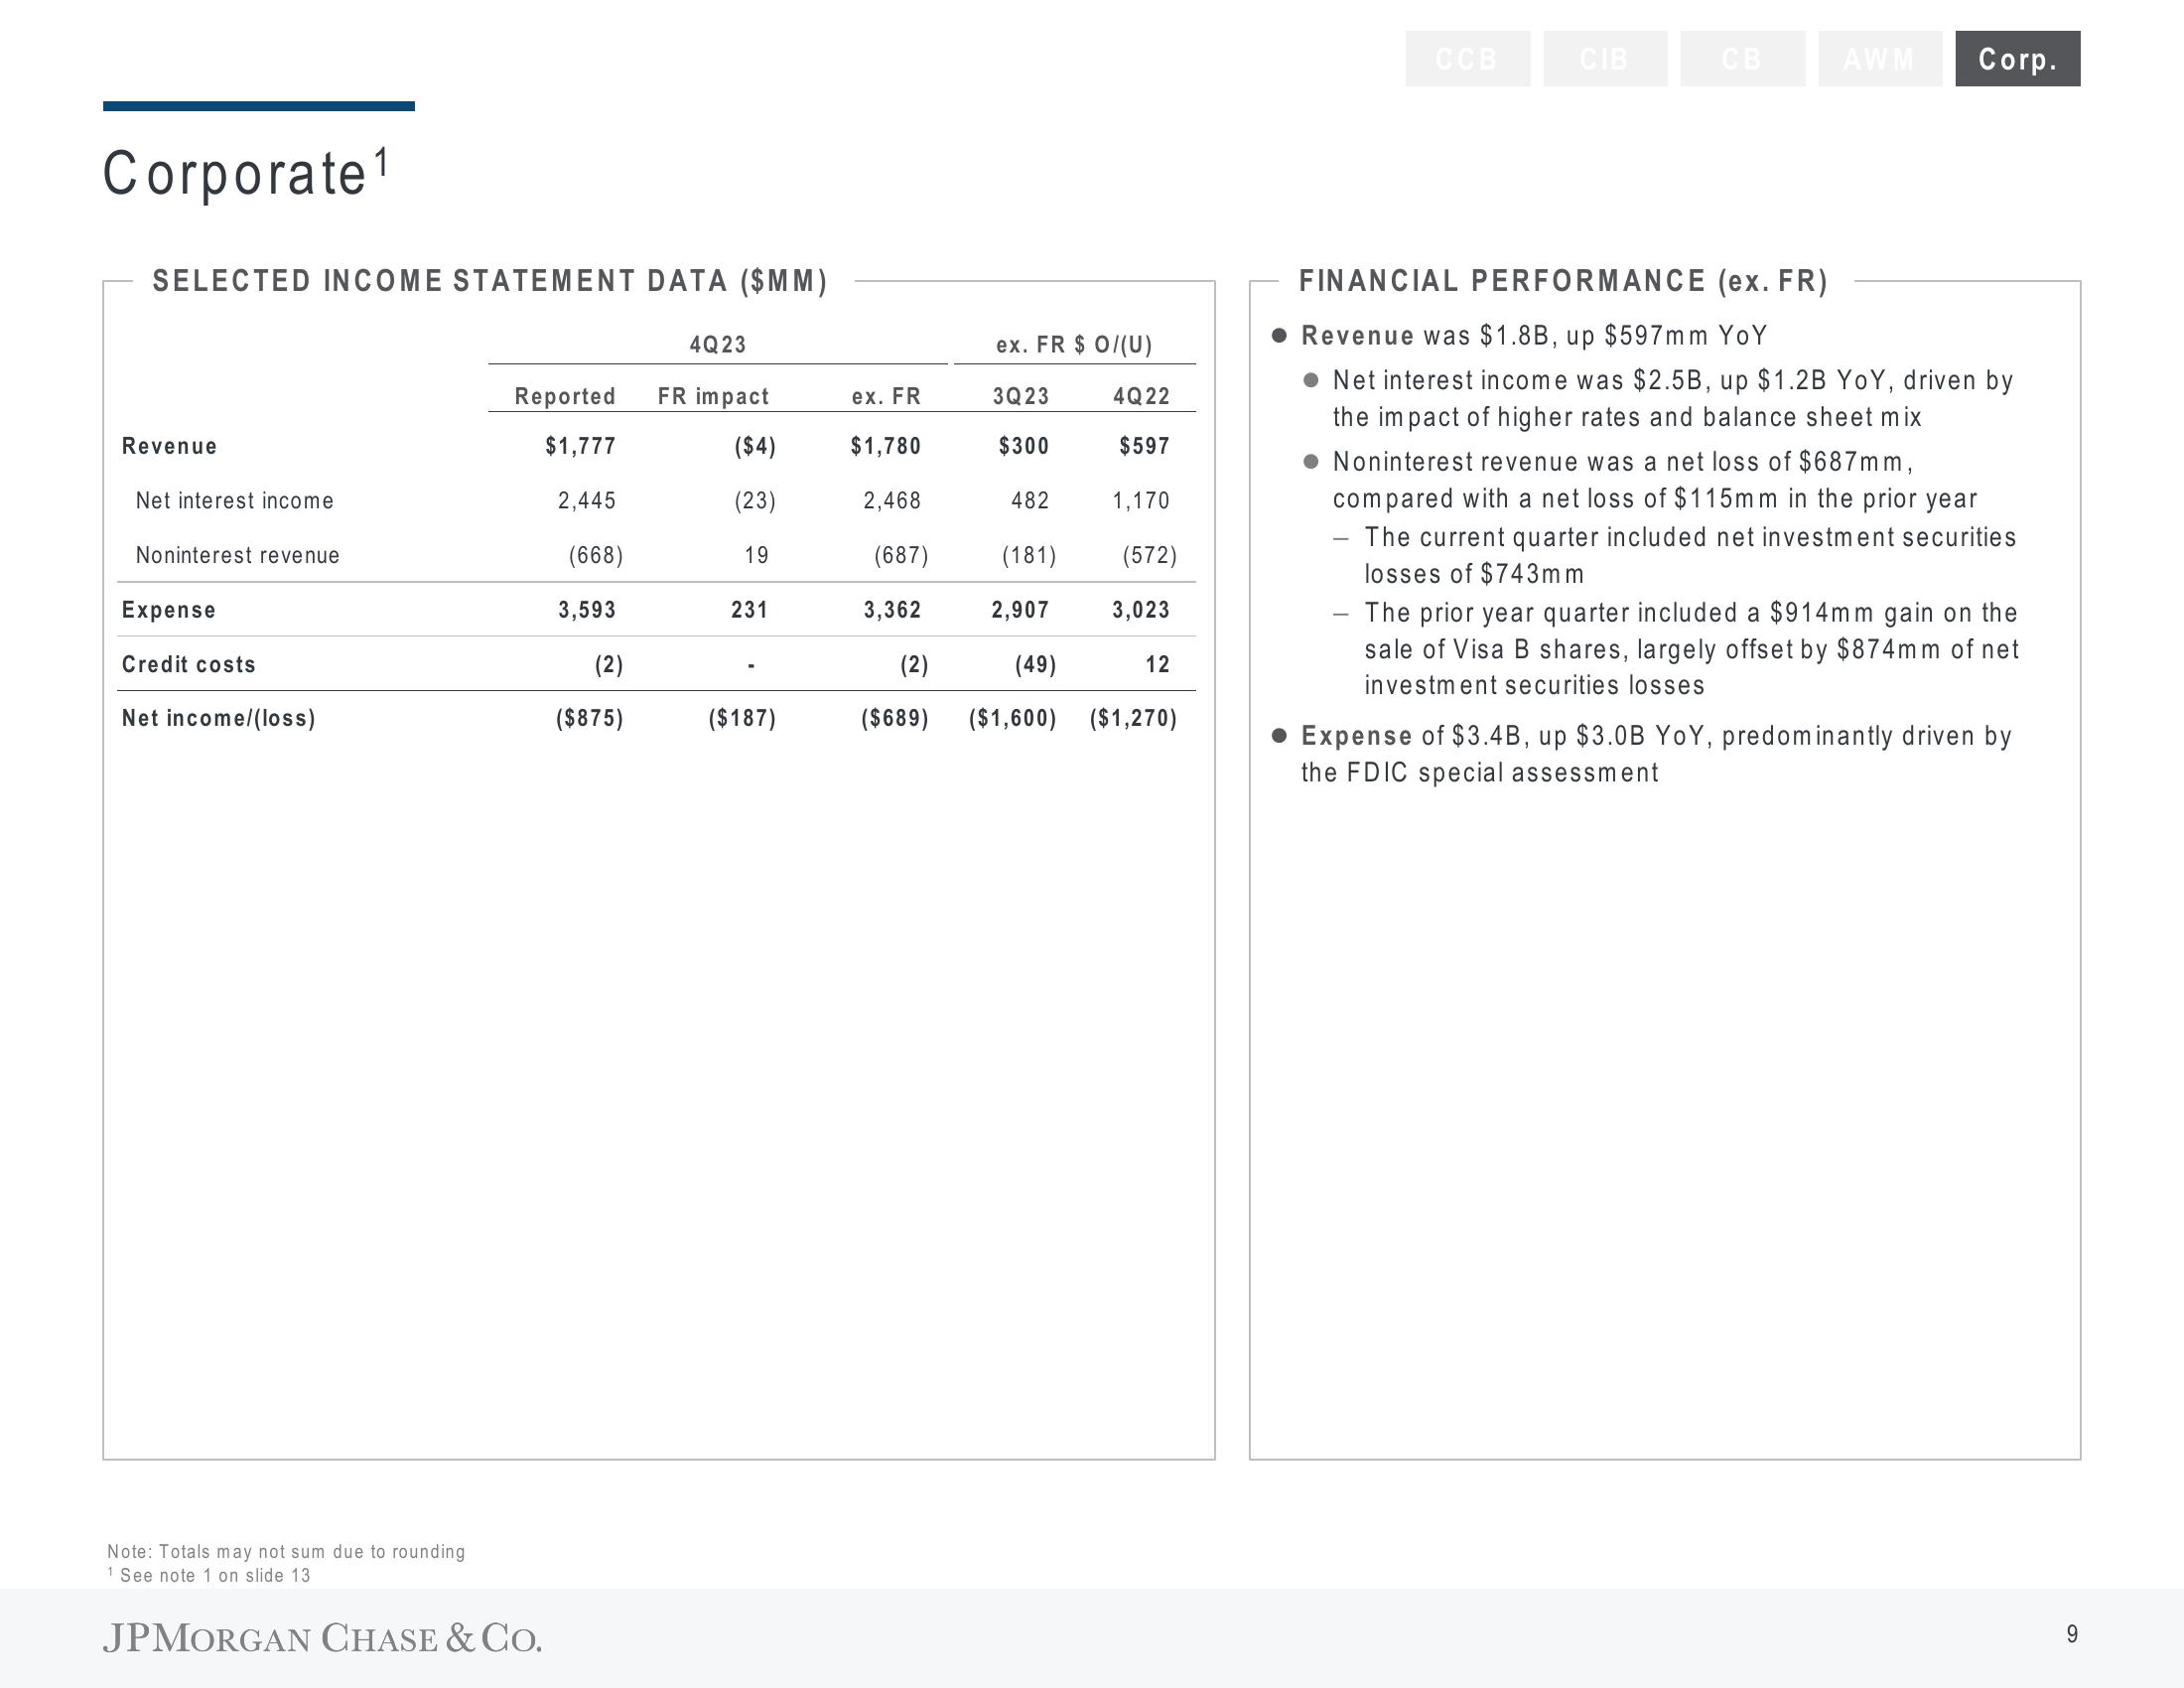
Revenue was $1.8B, up $597mm YoY
Net interest income was $2.5B, up $1.2B YoY, driven by
the impact of higher rates and balance sheet mix
Noninterest revenue was a net loss of $687mm,
compared with a net loss of $115mm in the prior year
The current quarter included net investment securities
losses of $743mm
- The prior year quarter included a $914mm gain on the
sale of Visa B shares, largely offset by $874mm of net
investment securities losses
Expense of $3.4B, up $3.0B YoY, predominantly driven by
the FDIC special assessment
9View entire presentation