HHR Investor Presentation Deck
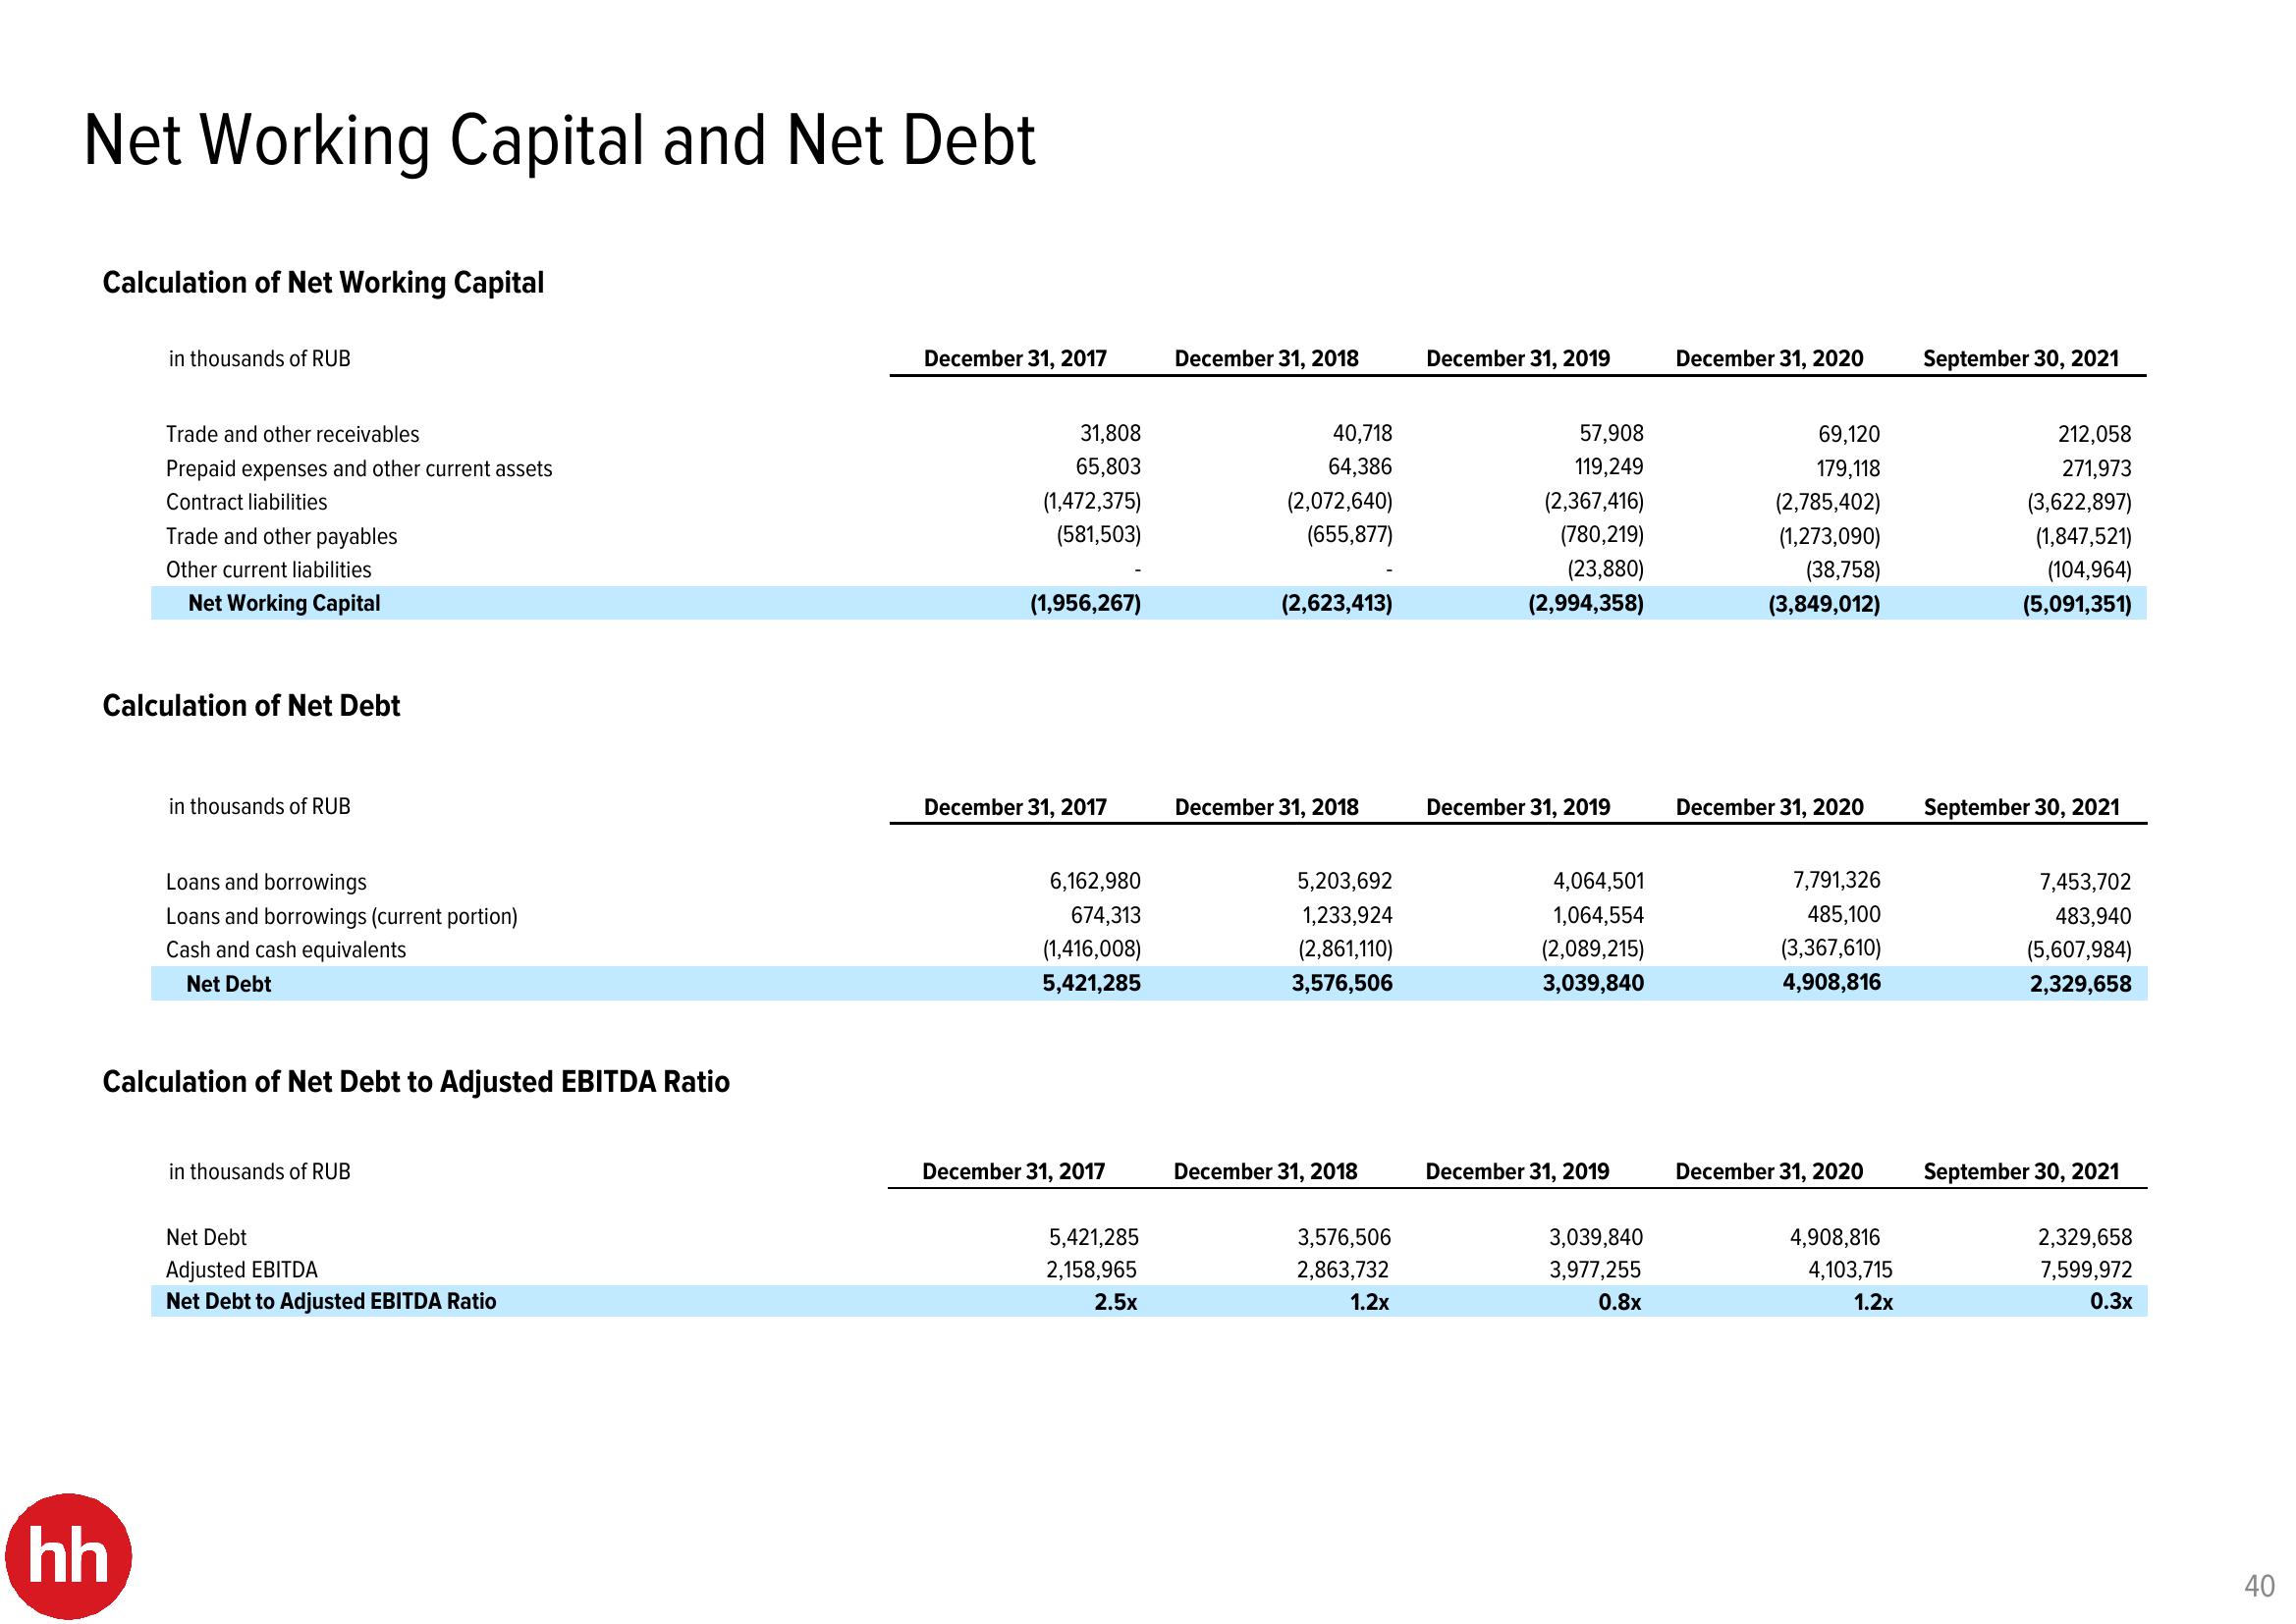
Net Working Capital and Net Debt
Calculation of Net Working Capital
in thousands of RUB
Trade and other receivables
Prepaid expenses and other current assets
Contract liabilities
hh
Trade and other payables
Other current liabilities
Net Working Capital
Calculation of Net Debt
in thousands of RUB
Loans and borrowings
Loans and borrowings (current portion)
Cash and cash equivalents
Net Debt
Calculation of Net Debt to Adjusted EBITDA Ratio
in thousands of RUB
Net Debt
Adjusted EBITDA
Net Debt to Adjusted EBITDA Ratio
December 31, 2017
31,808
65,803
(1,472,375)
(581,503)
(1,956,267)
December 31, 2017
6,162,980
674,313
(1,416,008)
5,421,285
December 31, 2017
5,421,285
2,158,965
2.5x
December 31, 2018
40,718
64,386
(2,072,640)
(655,877)
(2,623,413)
December 31, 2018
5,203,692
1,233,924
(2,861,110)
3,576,506
December 31, 2018
3,576,506
2,863,732
1.2x
December 31, 2019
57,908
119,249
(2,367,416)
(780,219)
(23,880)
(2,994,358)
December 31, 2019
4,064,501
1,064,554
(2,089,215)
3,039,840
December 31, 2019
3,039,840
3,977,255
0.8x
December 31, 2020
69,120
179,118
(2,785,402)
(1,273,090)
(38,758)
(3,849,012)
December 31, 2020
7,791,326
485,100
(3,367,610)
4,908,816
December 31, 2020
4,908,816
4,103,715
1.2x
September 30, 2021
212,058
271,973
(3,622,897)
(1,847,521)
(104,964)
(5,091,351)
September 30, 2021
7,453,702
483,940
(5,607,984)
2,329,658
September 30, 2021
2,329,658
7,599,972
0.3x
40View entire presentation