NuStar Energy Investor Conference Presentation Deck
NuStar
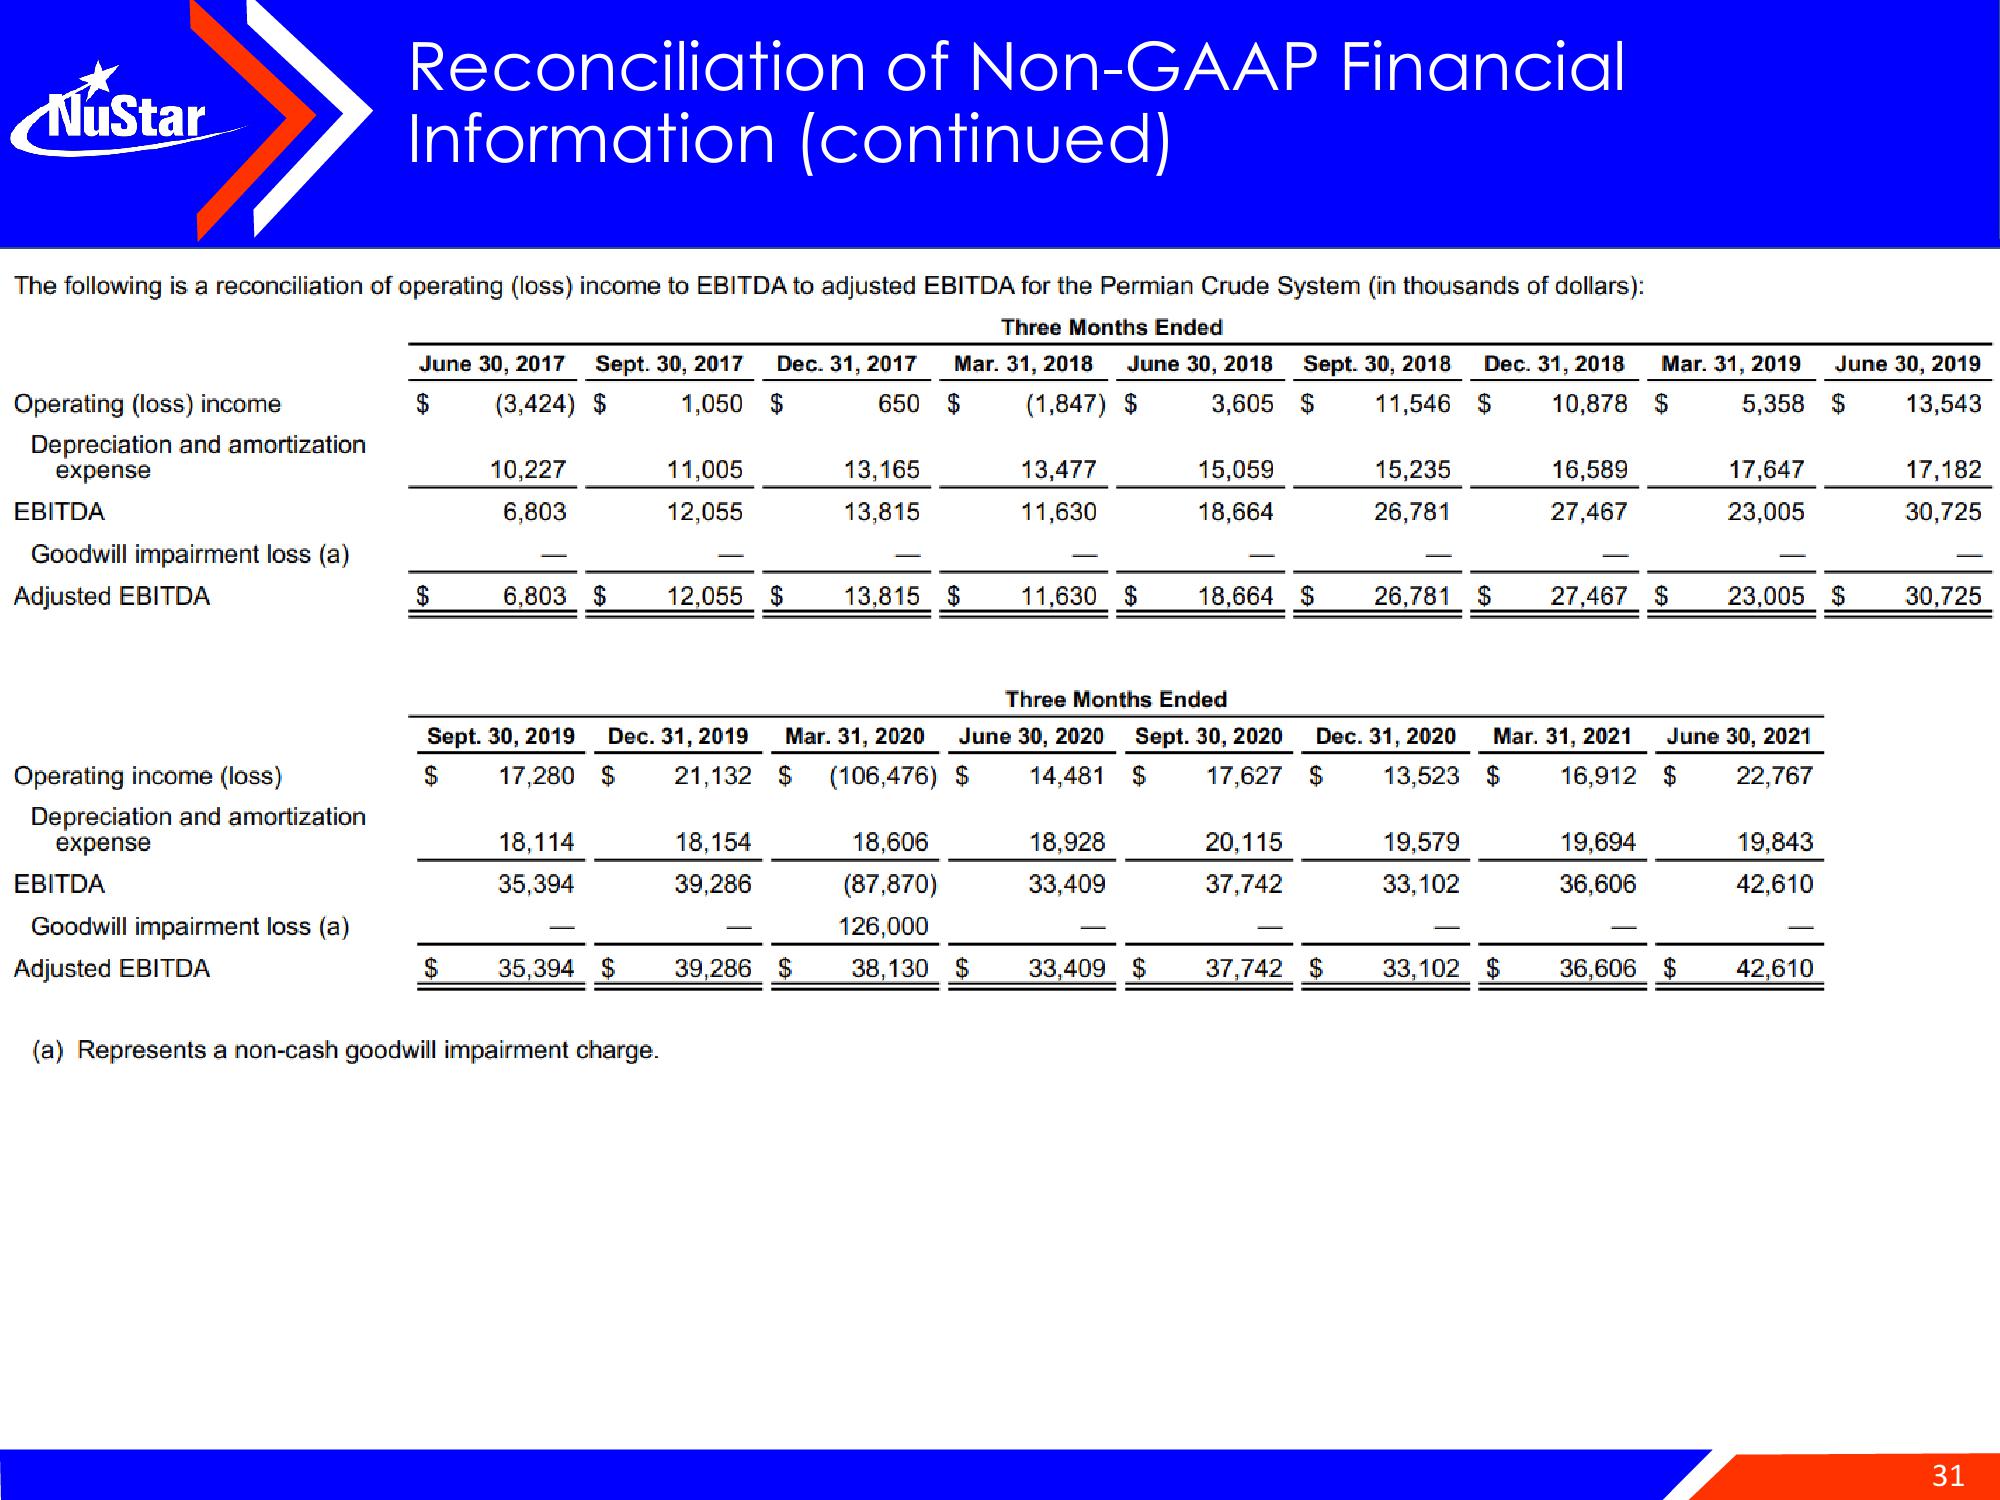
The following is a reconciliation of operating (loss) income to EBITDA to adjusted EBITDA for the Permian Crude System (in thousands of dollars):
Three Months Ended
Mar. 31, 2018 June 30, 2018
$ (1,847) $
Operating (loss) income
Depreciation and amortization
expense
EBITDA
Goodwill impairment loss (a)
Adjusted EBITDA
Operating income (loss)
Depreciation and amortization
expense
Reconciliation of Non-GAAP Financial
Information (continued)
EBITDA
Goodwill impairment loss (a)
Adjusted EBITDA
June 30, 2017 Sept. 30, 2017 Dec. 31, 2017
(3,424) $ 1,050 $
650
$
10,227
6,803
$
6,803 $ 12,055 $ 13,815 $
Sept. 30, 2019 Dec. 31, 2019 Mar. 31, 2020
17,280 $ 21,132 $ (106,476) $
$
18,114
35,394
11,005
12,055
35,394 $
(a) Represents a non-cash goodwill impairment charge.
13,165
13,815
18,154
39,286
39,286 $
18,606
(87,870)
126,000
13,477
11,630
38,130 $
11,630 $
June 30, 2020
14,481
Sept. 30, 2018 Dec. 31, 2018
3,605 $ 11,546 $
18,928
33,409
15,059
18,664
Three Months Ended
Sept. 30, 2020
$ 17,627
20,115
37,742
15,235
26,781
18,664 $ 26,781 $ 27,467 $ 23,005 $
Dec. 31, 2020
$ 13,523 $
33,409 $ 37,742 $
19,579
33,102
10,878 $
16,589
27,467
Mar. 31, 2019 June 30, 2019
5,358 $ 13,543
17,647
23,005
Mar. 31, 2021 June 30, 2021
16,912 $ 22,767
19,694
36,606
19,843
42,610
33,102 $ 36,606 $ 42,610
17,182
30,725
30,725
31View entire presentation