WeWork Investor Presentation Deck
Geographically diverse revenue streams
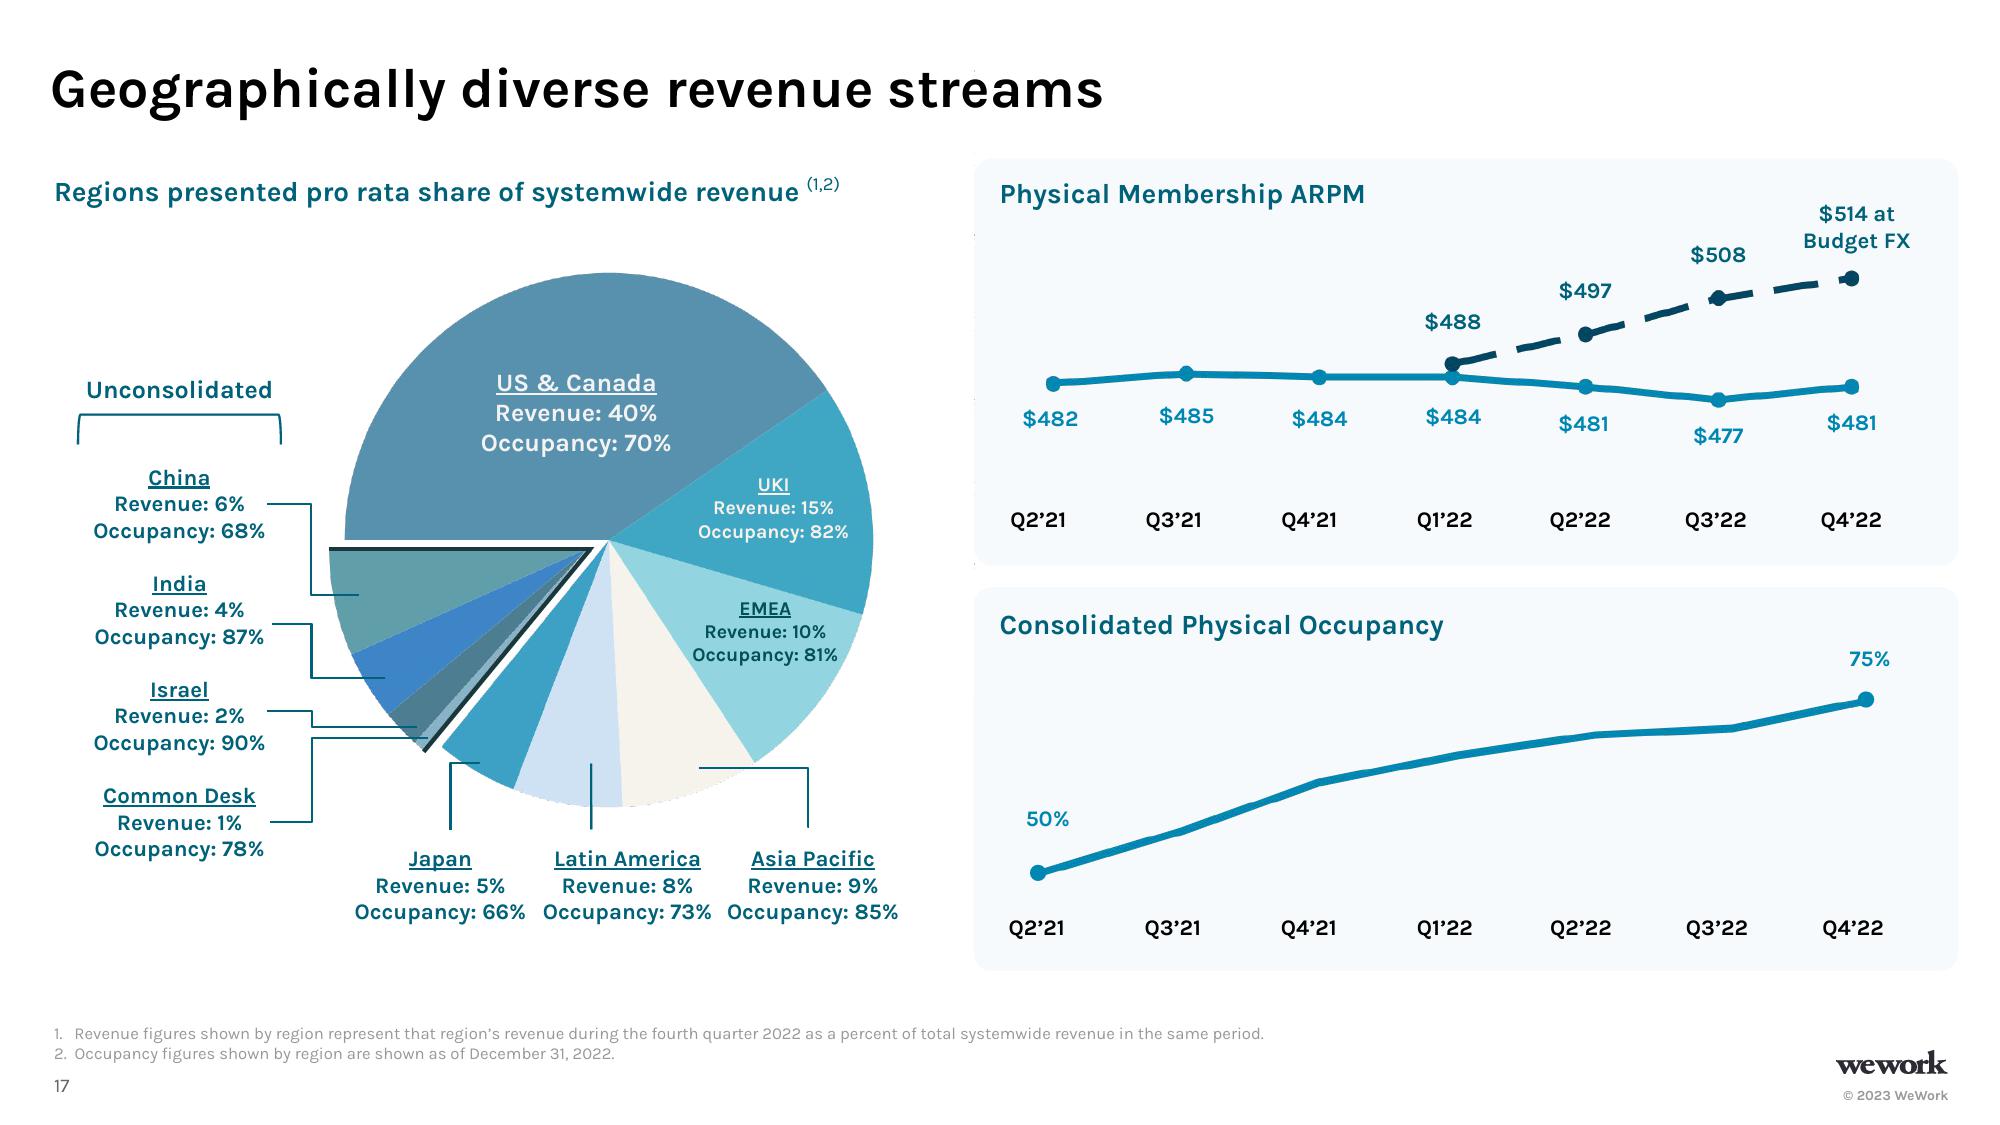
Regions presented pro rata share of systemwide revenue
Unconsolidated
China
Revenue: 6%
Occupancy: 68%
India
Revenue: 4%
Occupancy: 87%
Israel
Revenue: 2%
Occupancy: 90%
Common Desk
Revenue: 1%
Occupancy: 78%
US & Canada
Revenue: 40%
Occupancy: 70%
(1,2)
UKI
Revenue: 15%
Occupancy: 82%
EMEA
Revenue: 10%
Occupancy: 81%
Latin America
Japan
Revenue: 5%
Asia Pacific
Revenue: 9%
Revenue: 8%
Occupancy: 66% Occupancy: 73% Occupancy: 85%
Physical Membership ARPM
$482
Q2'21
50%
$485
Q2'21
Q3'21
Q3'21
$484
1. Revenue figures shown by region represent that region's revenue during the fourth quarter 2022 as a percent of total systemwide revenue in the same period.
2. Occupancy figures shown by region are shown as of December 31, 2022.
17
Q4'21
Consolidated Physical Occupancy
$488
Q4'21
$484
Q1'22
Q1'22
$497
$481
Q2'22
Q2'22
$508
$477
Q3'22
Q3'22
$514 at
Budget FX
$481
Q4'22
75%
Q4'22
wework
© 2023 WeWorkView entire presentation