TPG Results Presentation Deck
Pro Forma GAAP Statements of Operations
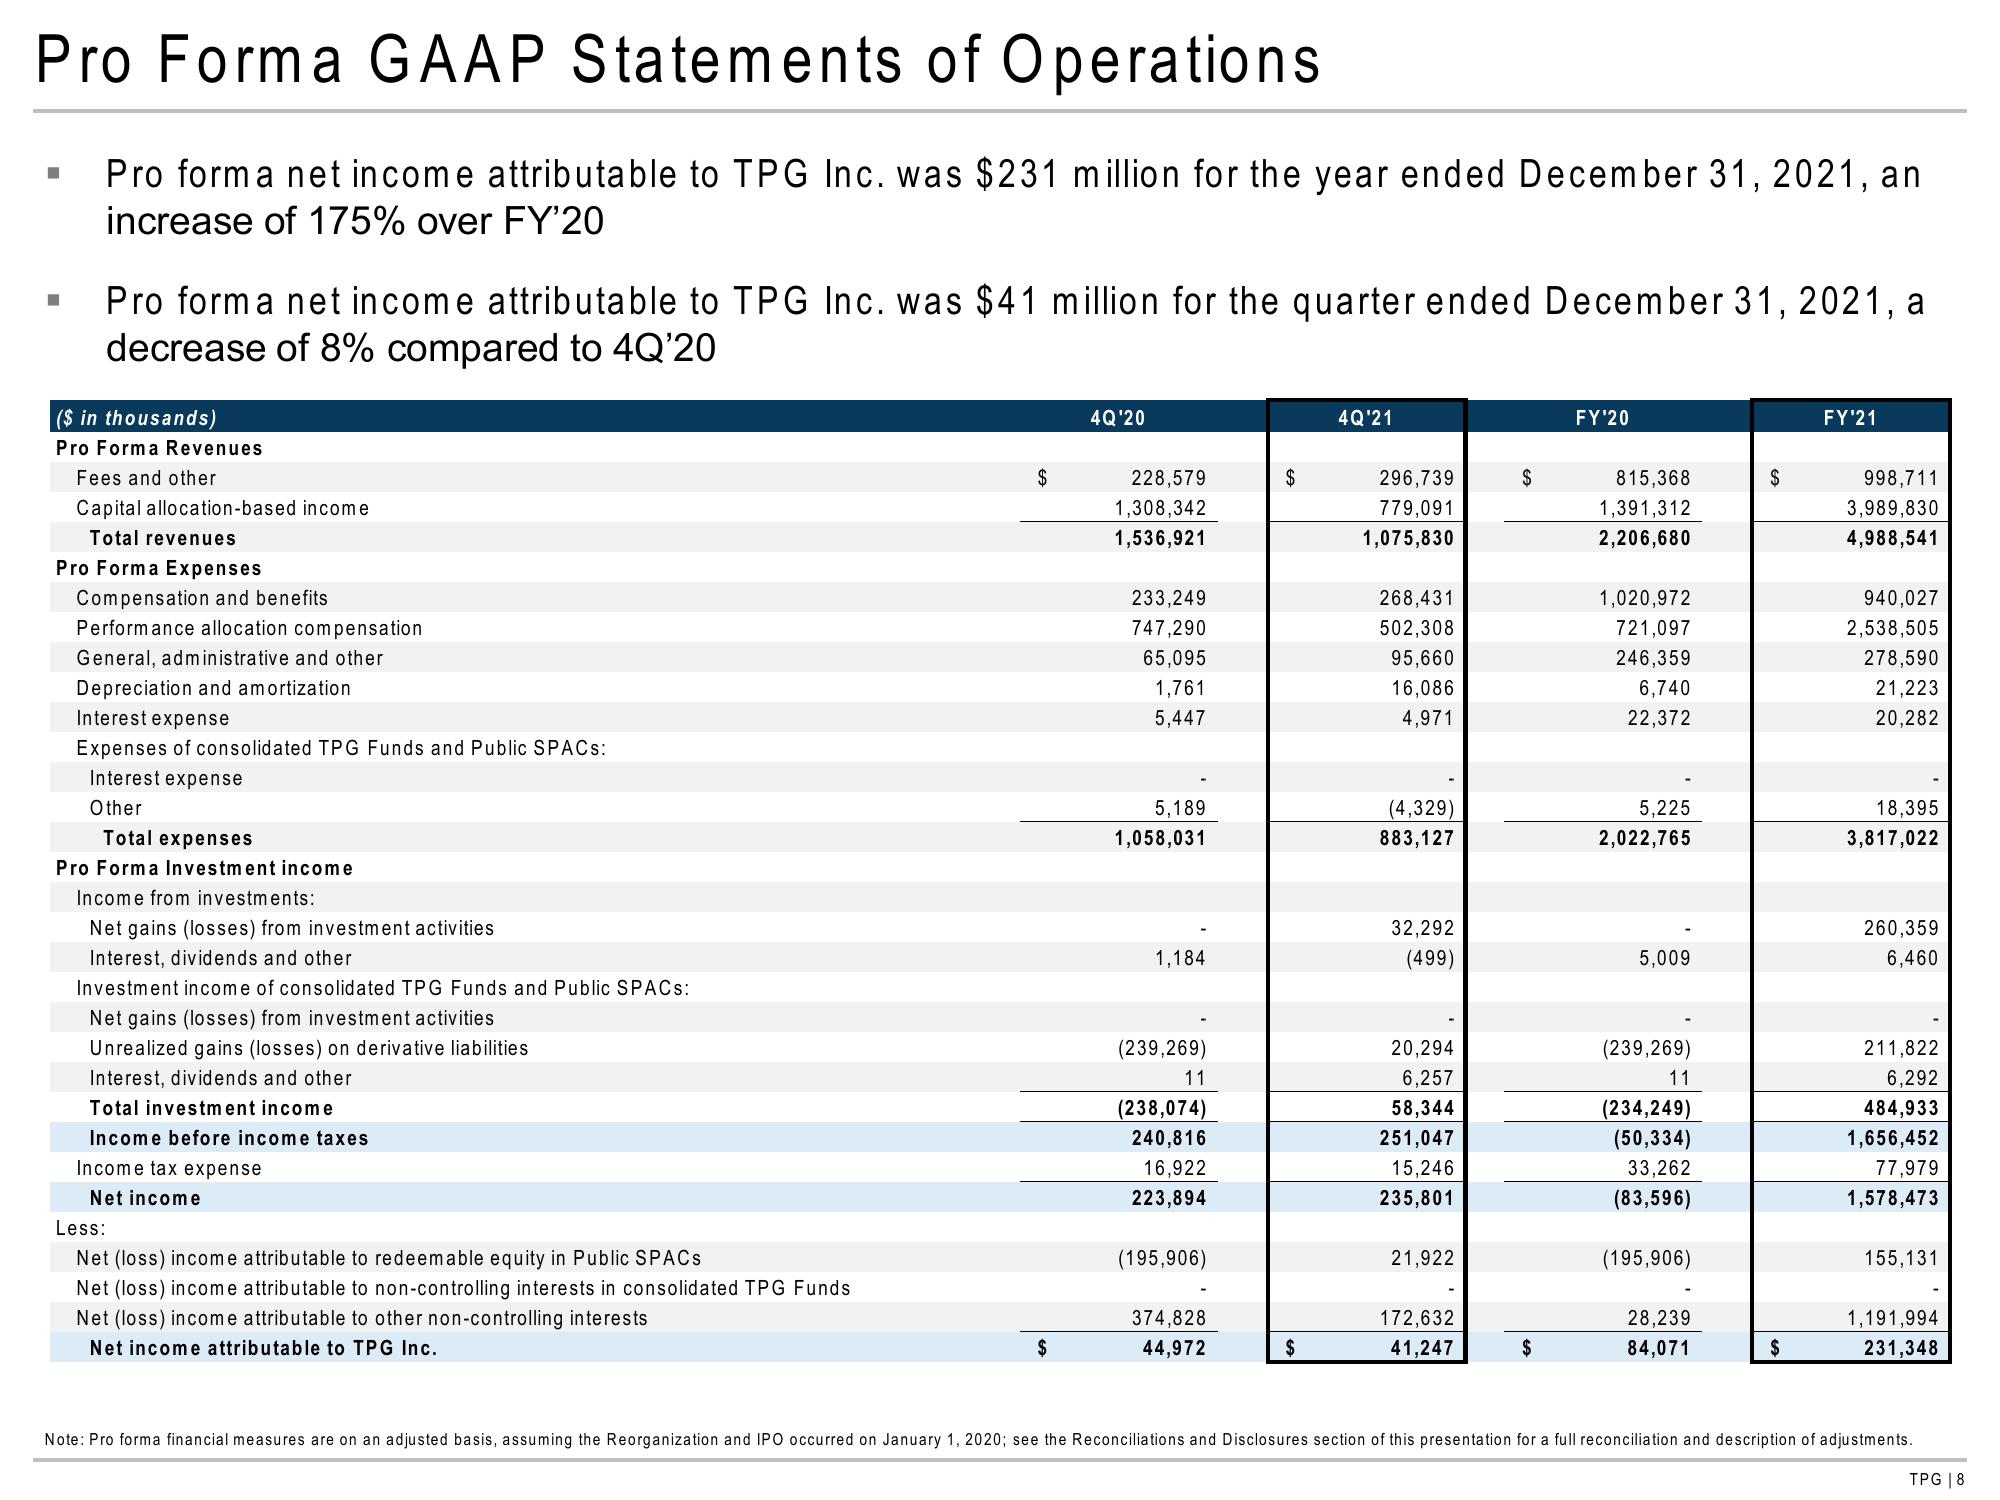
Pro form a net income attributable to TPG Inc. was $231 million for the year ended December 31, 2021, an
increase of 175% over FY'20
■
■
Pro forma net income attributable to TPG Inc. was $41 million for the quarter ended December 31, 2021, a
decrease of 8% compared to 4Q'20
($ in thousands)
Pro Forma Revenues
Fees and other
Capital allocation-based income
Total revenues
Pro Forma Expenses
Compensation and benefits
Performance allocation compensation
General, administrative and other
Depreciation and amortization
Interest expense
Expenses of consolidated TPG Funds and Public SPACs:
Interest expense
Other
Total expenses
Pro Forma Investment income
Income from investments:
Net gains (losses) from investment activities
Interest, dividends and other
Investment income of consolidated TPG Funds and Public SPACs:
Net gains (losses) from investment activities
Unrealized gains (losses) on derivative liabilities
Interest, dividends and other
Total investment income
Income before income taxes
Income tax expense
Net income
Less:
Net (loss) income attributable to redeemable equity in Public SPACs
Net (loss) income attributable to non-controlling interests in consolidated TPG Funds
Net (loss) income attributable to other non-controlling interests
Net income attributable to TPG Inc.
$
$
4Q'20
228,579
1,308,342
1,536,921
233,249
747,290
65,095
1,761
5,447
5,189
1,058,031
1,184
(239,269)
11
(238,074)
240,816
16,922
223,894
(195,906)
374,828
44,972
$
$
4Q'21
296,739
779,091
1,075,830
268,431
502,308
95,660
16,086
4,971
(4,329)
883,127
32,292
(499)
20,294
6,257
58,344
251,047
15,246
235,801
21,922
172,632
41,247
$
$
FY'20
815,368
1,391,312
2,206,680
1,020,972
721,097
246,359
6,740
22,372
5,225
2,022,765
5,009
(239,269)
11
(234,249)
(50,334)
33,262
(83,596)
(195,906)
28,239
84,071
$
$
FY'21
998,711
3,989,830
4,988,541
940,027
2,538,505
278,590
21,223
20,282
18,395
3,817,022
260,359
6,460
211,822
6,292
484,933
1,656,452
77,979
1,578,473
155,131
1,191,994
231,348
Note: Pro forma financial measures are on an adjusted basis, assuming the Reorganization and IPO occurred on January 1, 2020; see the Reconciliations and Disclosures section of this presentation for a full reconciliation and description of adjustments.
TPG 8View entire presentation