AMD Results Presentation Deck slide image

AMD Results Presentation Deck

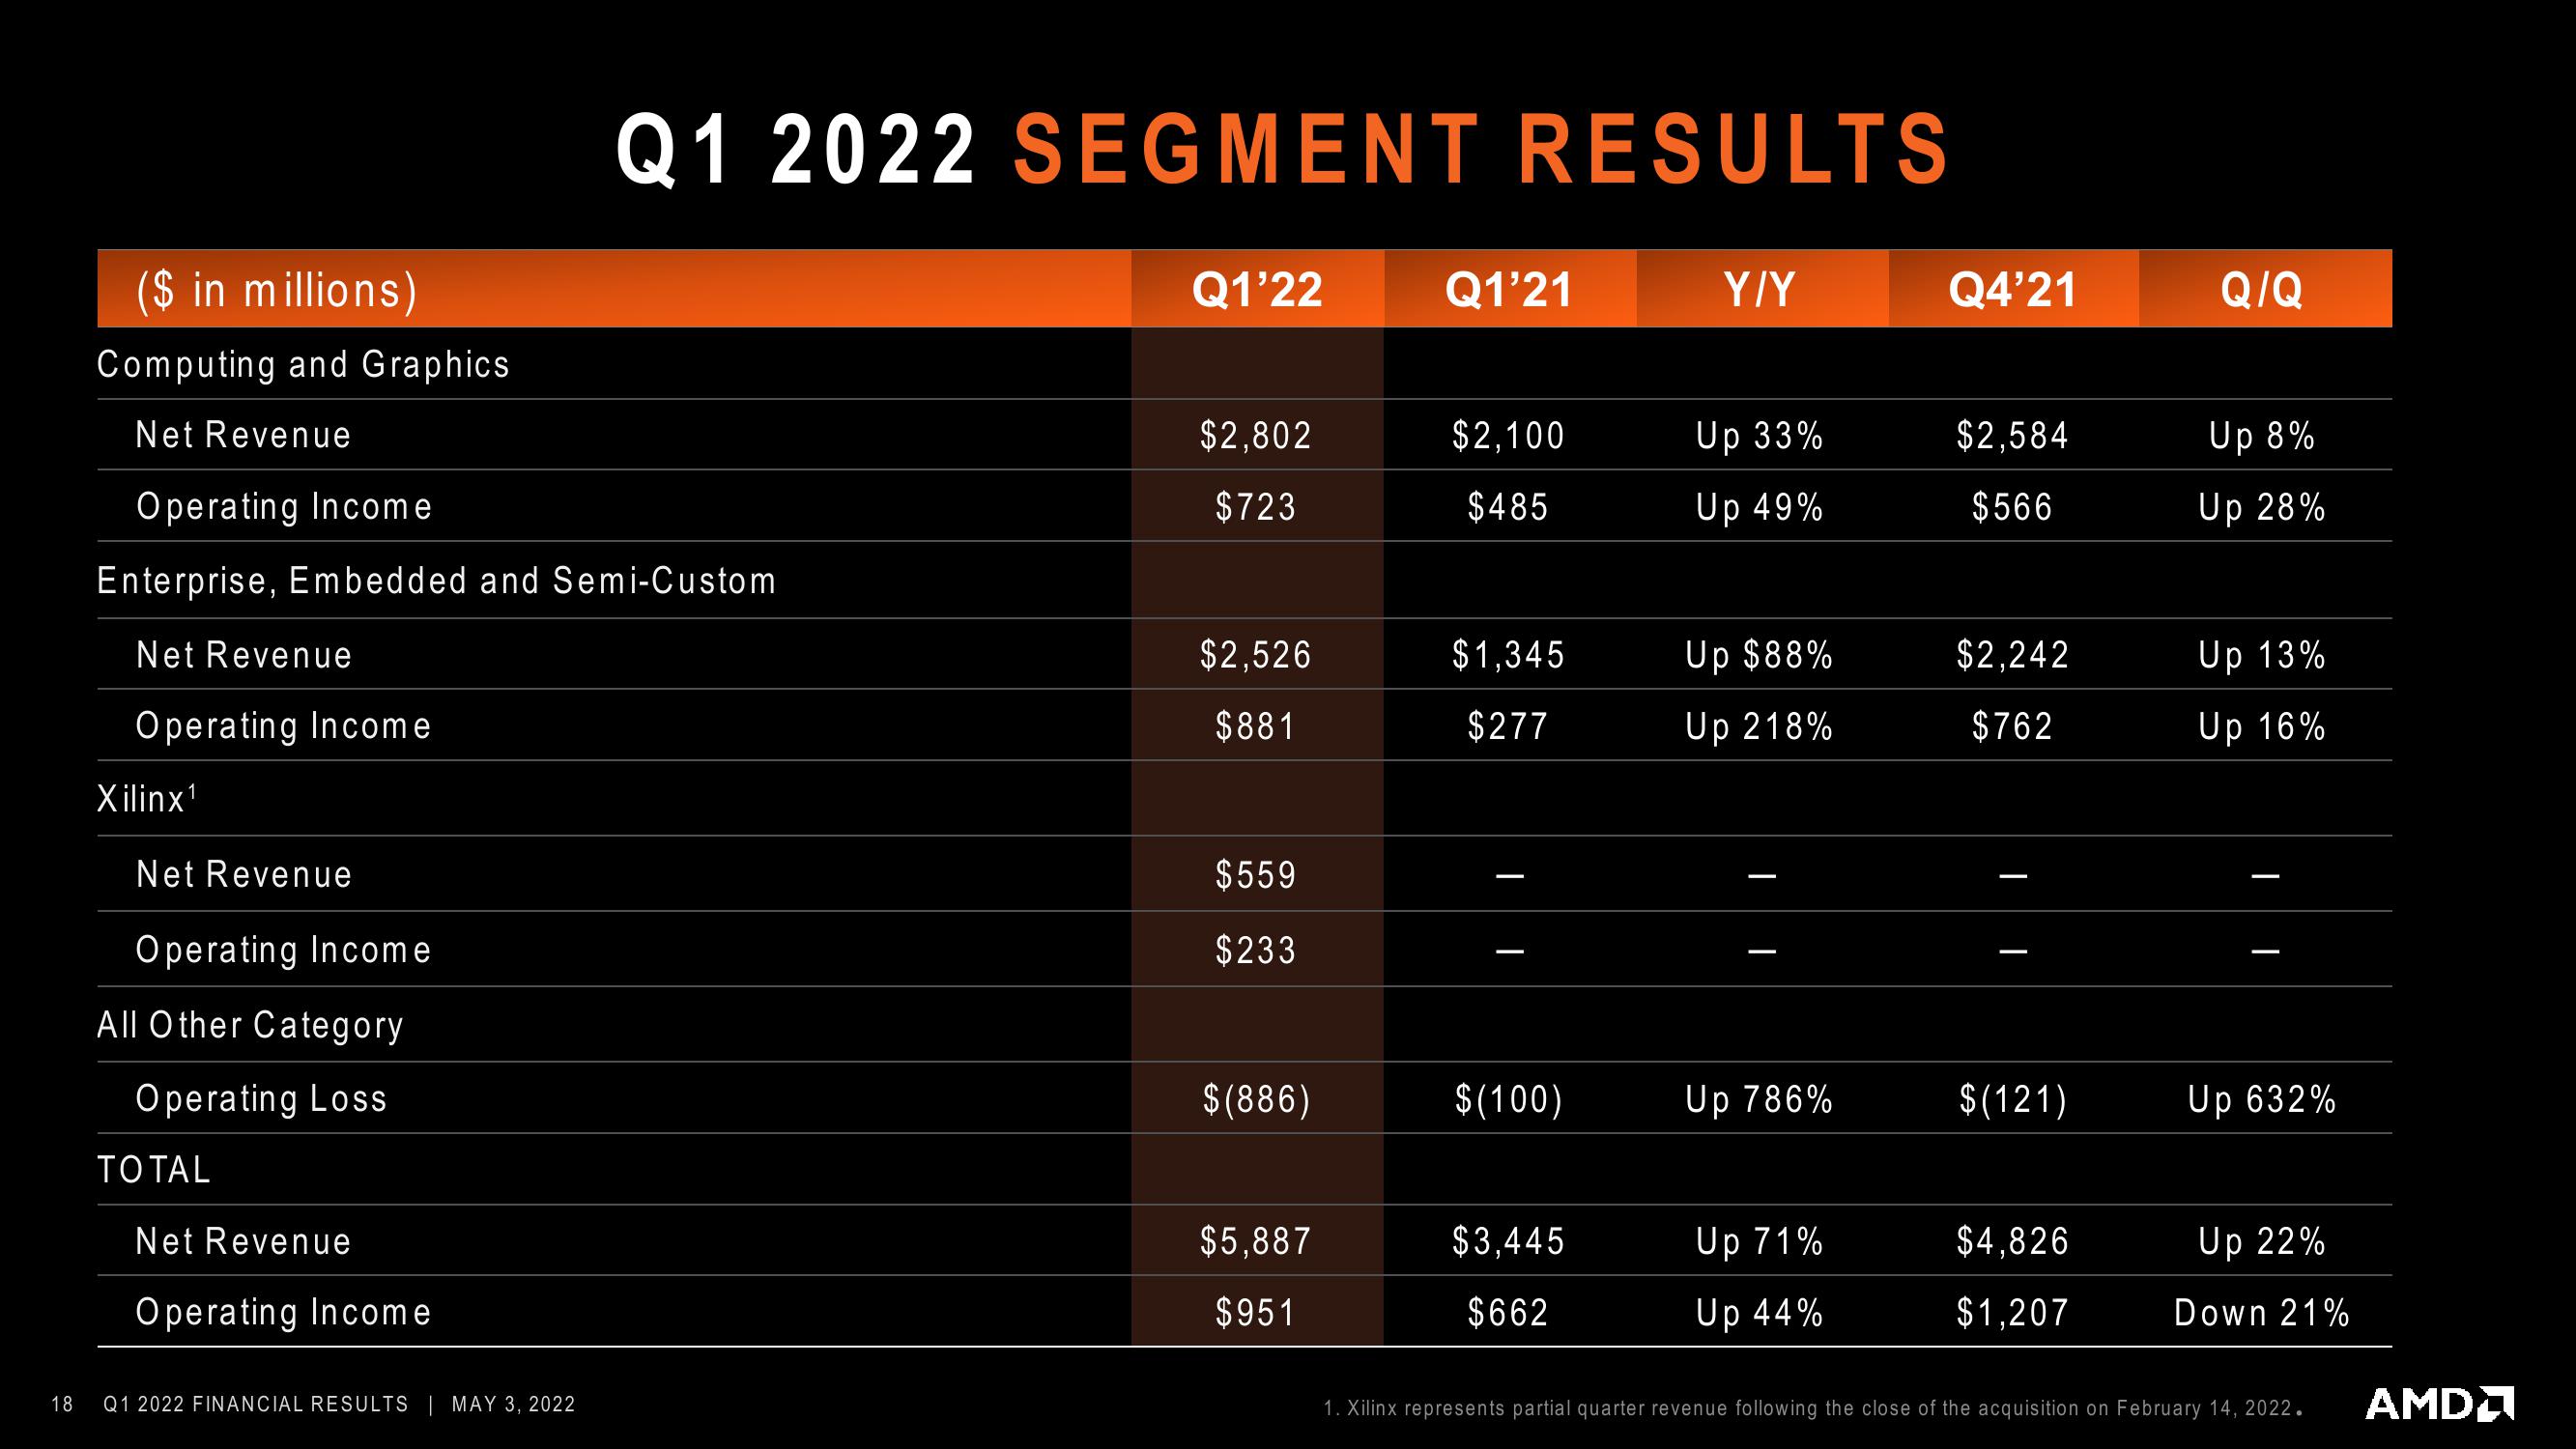
18 ($ in millions) Computing and Graphics Net Revenue Operating Income Enterprise, Embedded and Semi-Custom Net Revenue Operating Income Xilinx¹ Net Revenue Operating Income All Other Category Operating Loss TOTAL Net Revenue Operating Income Q1 2022 SEGMENT RESULTS Q1 2022 FINANCIAL RESULTS | MAY 3, 2022 Q1'22 $2,802 $723 $2,526 $881 $559 $233 $(886) $5,887 $951 Q1'21 $2,100 $485 $1,345 $277 $(100) $3,445 $662 Y/Y Up 33% Up 49% Up $88% Up 218% | Up 786% Up 71% Up 44% Q4'21 $2,584 $566 $2,242 $762 | $(121) $4,826 $1,207 Q/Q Up 8% Up 28% Up 13% Up 16% | | Up 632% Up 22% Down 21% 1. Xilinx represents partial quarter revenue following the close of the acquisition on February 14, 2022. AMD
View entire presentation