Evercore Investment Banking Pitch Book
Financial Analysis
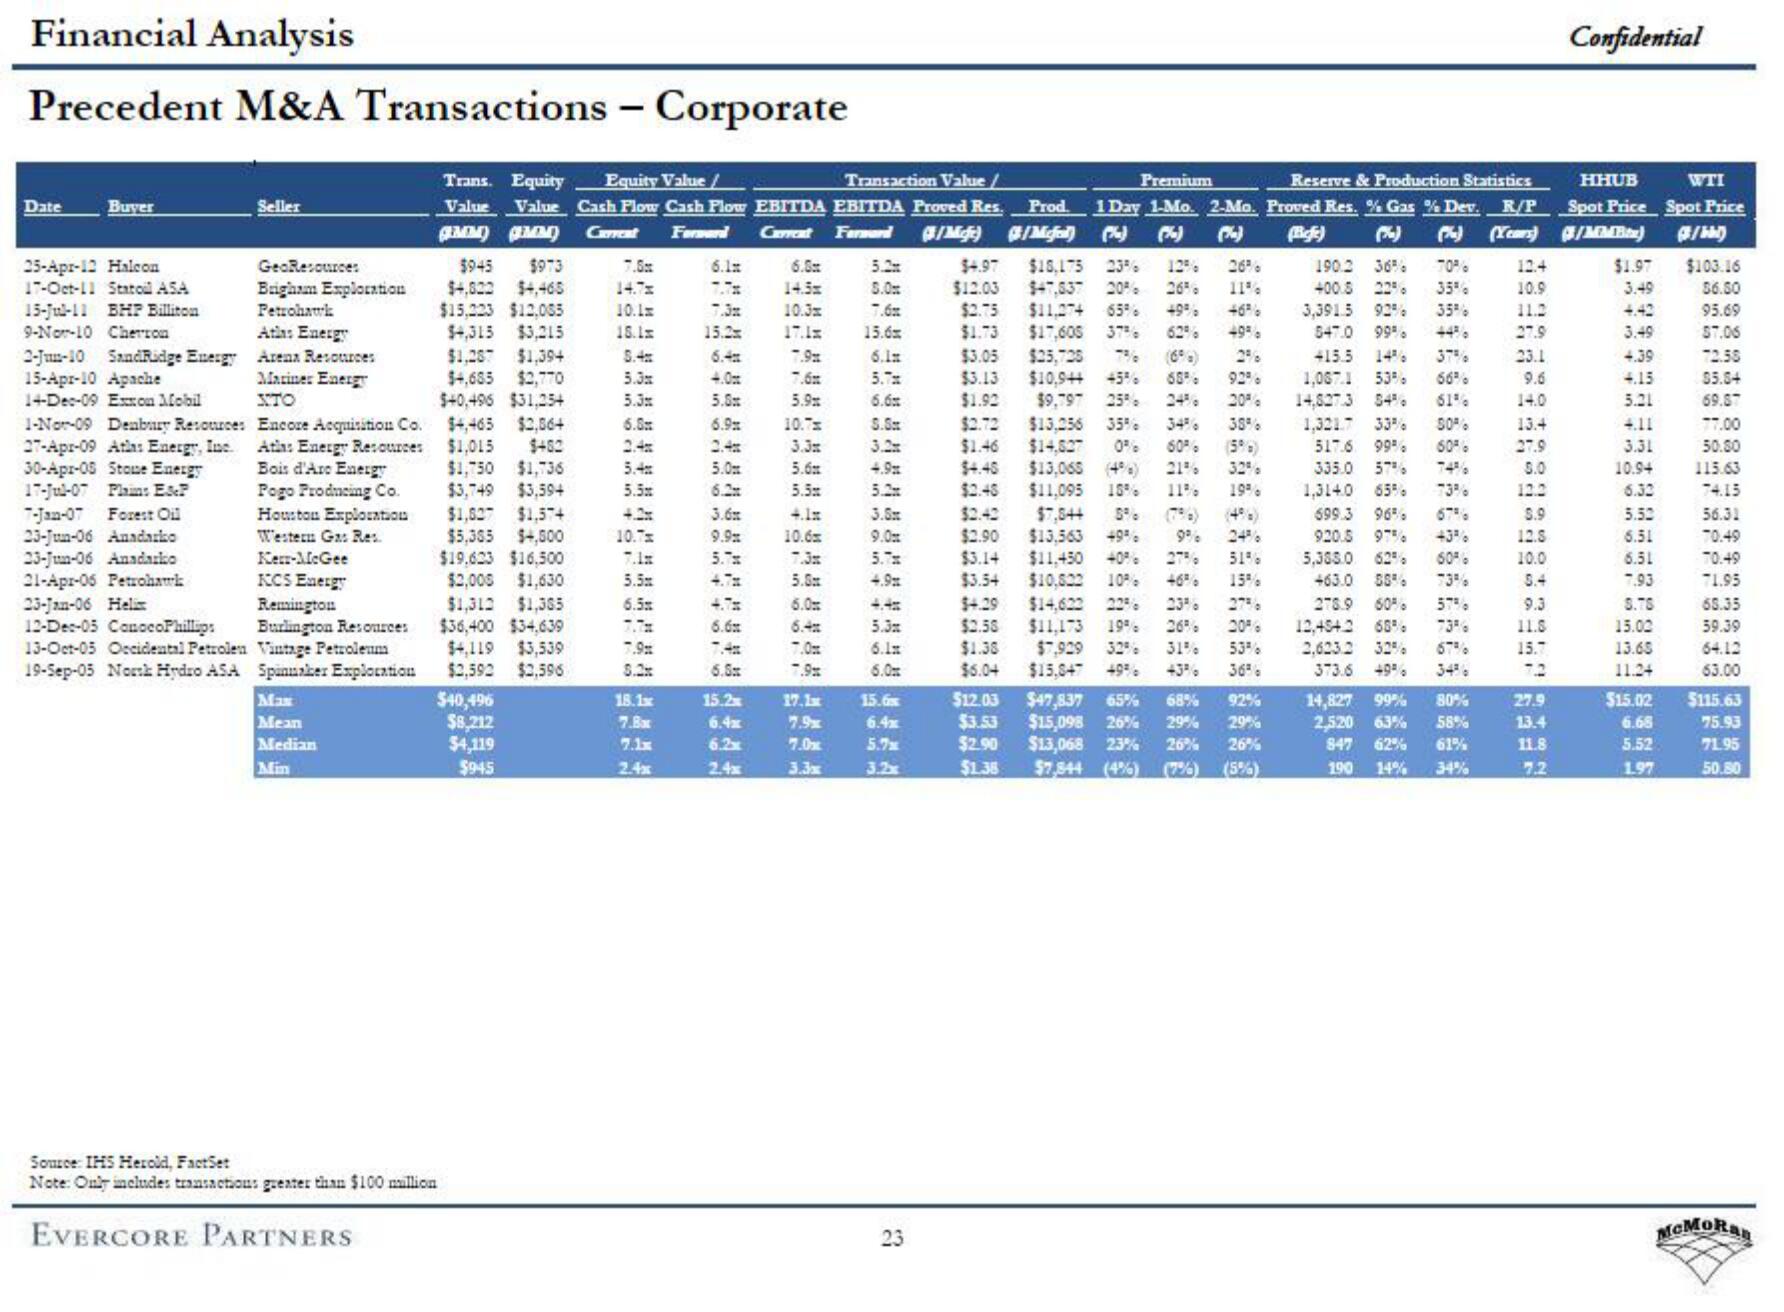
Precedent M&A Transactions - Corporate
Date
Buyer
25-Apr-12 Halcon
17-Oct-11 Statoil ASA
15-Jul-11 BHP Billiton
9-Nor-10 Cherron
Seller
GeoResources
Brigham Exploration
Petrohauk
Atlas Energy
2-Jun-10 SandRidge Energy Arenn Resources
15-Apr-10 Apache
Mariner Energy
STO
14-Dec-09 Exxon Mobil
1-Nor-09 Deabury Resources
27-Apr-09 Atlas Energy, Inc.
30-Apr-08 Stoce Energy
17-Jul-07 Plain: E&P
7-Jan-07 Forest Oil
23-Jun-06 Anadarko
23-Jun-06 Anadarko
21-Apr-05 Petrohawk
23-Jan-06 Heli
12-Dec-05 ConocoPhillips
13-Oct-05 Occidental Petrolen
19-Sep-05 North Hydro ASA
Encore Acquisition Co.
Ath: Energy Resources
Bois d'Arc Energy
Pogo Producing Co.
Houston Exploration
Western Gas Res.
Kerr-McGee
KCS Energy
Remington
Burlington Resources
Vintage Petroleum
Spinuaker Exploration
Max
Mean
Median
Min
Transaction Value/
Premium
Reserve & Production Statistics
Trans. Equity Equity Value /
Value Value Cash Flow Cash Flow EBITDA EBITDA Proved Res. Prod. 1 Day 1-Mo. 2-Mo. Proved Res. % Gas % Dev. R/P
GEMM) (MM) Carreat Fernand
Farmard /Mcft) G/Mcfol
(%)
(Refe)
(Years)
12.4
10.9
11.2
27.9
23.1
(x)
190.2 36% 70%
400.8 22% 35%
3,391.5 92% 35%
547.0 99%
415.5
37%
1,067.1 53% 66%
14,827.3 54% 61%
1,321.7 33% 50%
517.6 99%
335.0 57%
1,3140 65%
9.6
14.0
13.4
27.9
5.0
12.2
60%
74%
73%
5.9
699.3 96% 67%
920.5 97%
12.S
5,388.0 62% 60%
10.0
5.4
463.0 55% 73%
276.9 60% 57%
68% 73%
Source: IHS Herold, FactSet
Note: Only includes transactions greater than $100 million
EVERCORE PARTNERS
$945 $973
$4,822 $4,465
$15,223 $12,065
$4,315 $3,215
$1,287 $1,394
$4,685 $2,770
$+0,495 $31,25+4
$4,465 $2,56+
$1,015 $482
$1,750 $1,736
$3,749 $3,59+
$1,627 $1,574
$5,355 $4,500
$19.623 $16,500
$2,000 $1,630
$1,312 $1,365
$36,400 $34.639
$4,119 $3,539
$2,592 $2,596
$40,496
$8,212
$4,119
$945
7.5x
14.7%
10.1m
15.1m
5.4
5.3x
5.3x
6.8
2.4x
5.4
5.5
10.T=
5.5
6.5x
7.9%
8.2
18.1x
7.8x
7.1x
2.4x
6.1x
15.2
6.4
5.5x
6.9x
5.0
6.2
3.6m
9.9%
5.7x
4.7%
4.7%
6.6x
6.5x
15.2x
6.4x
6.2x
2.4x
6.8
l
10.3x
17.1=
7.9x
5.9x
10.7%
3.3x
5.6
5.5x
4.1=
10.6
5.6
6.0
7.0x
7.9%
17.1x
7.9
7.0x
3.3x
5.2
5.0
7.6x
15.6m
6.1x
5.7x
6.6x
5.S
4.9%
5.2
3.5m
9.0
5.7%
4.9%
5.3x
6.1x
6.0
15.6
6.4x
5.7
3.2x
23
$4.97 $15,175 23%
26%
$12.03 $47,537 20% 26%
11%
$2.75 $11,274 65% 49% 46%
$1.73 $17,605 37% 62% 49%
$3.05 $25,728
(6%) 2%
$3.13 $10,9++ 45% 68% 92%
$1.92 $9,797 25%
20%
$2.72 $13,256 35%
38%
(5%)
32%
$2.45 $11,095 15% 11% 19%
$1.46 $14,827 0% 60%
$4.45 $13,065 (4%) 21%
$2.42 $7,544 5%
$2.90 $13,563 49%
$3.14 $11.450
27%
$3.54 $10,822 10%
46%
$4.29
22% 23%
$2.58 $11,173 19% 26% 20%
$1.38 $7,929 32% 31% 53%
$6.04 $15,847 49%
36%
$12.03 $47,837 65% 68% 92%
$3.53 $15,098 26% 29% 29%
$2.90 $13,068 23% 26% 26%
$1.38 $7,844 (4%)
(7%) (5%)
51%
15%
12,454.2
2,623.2
373.6 49% 34%
14,827 99% 80%
2,520 63% 58%
847 62% 61%
190
14% 34%
9.3
11.8
15.7
7.2
27.9
13.4
11.8
7.2
Confidential
HHUB WTI
Spot Price Spot Price
/MMBix) (/)
$103.16
56.50
95.69
$7.06
$1.97
3.49
4.42
3.49
4.39
4.15
5.21
4.11
3.31
10.94
6.32
5.52
6.51
6.51
7.93
S.TS
15.02
13.65
11.24
$15.02
6.68
5.52
1.97
72.58
$5.54
69.87
77.00
50.80
115.63
74.15
56.31
70.49
70.49
71.95
65.35
59.39
64.12
63.00
$115.63
75.93
71.95
50.80
MCMORanView entire presentation