Tudor, Pickering, Holt & Co Investment Banking
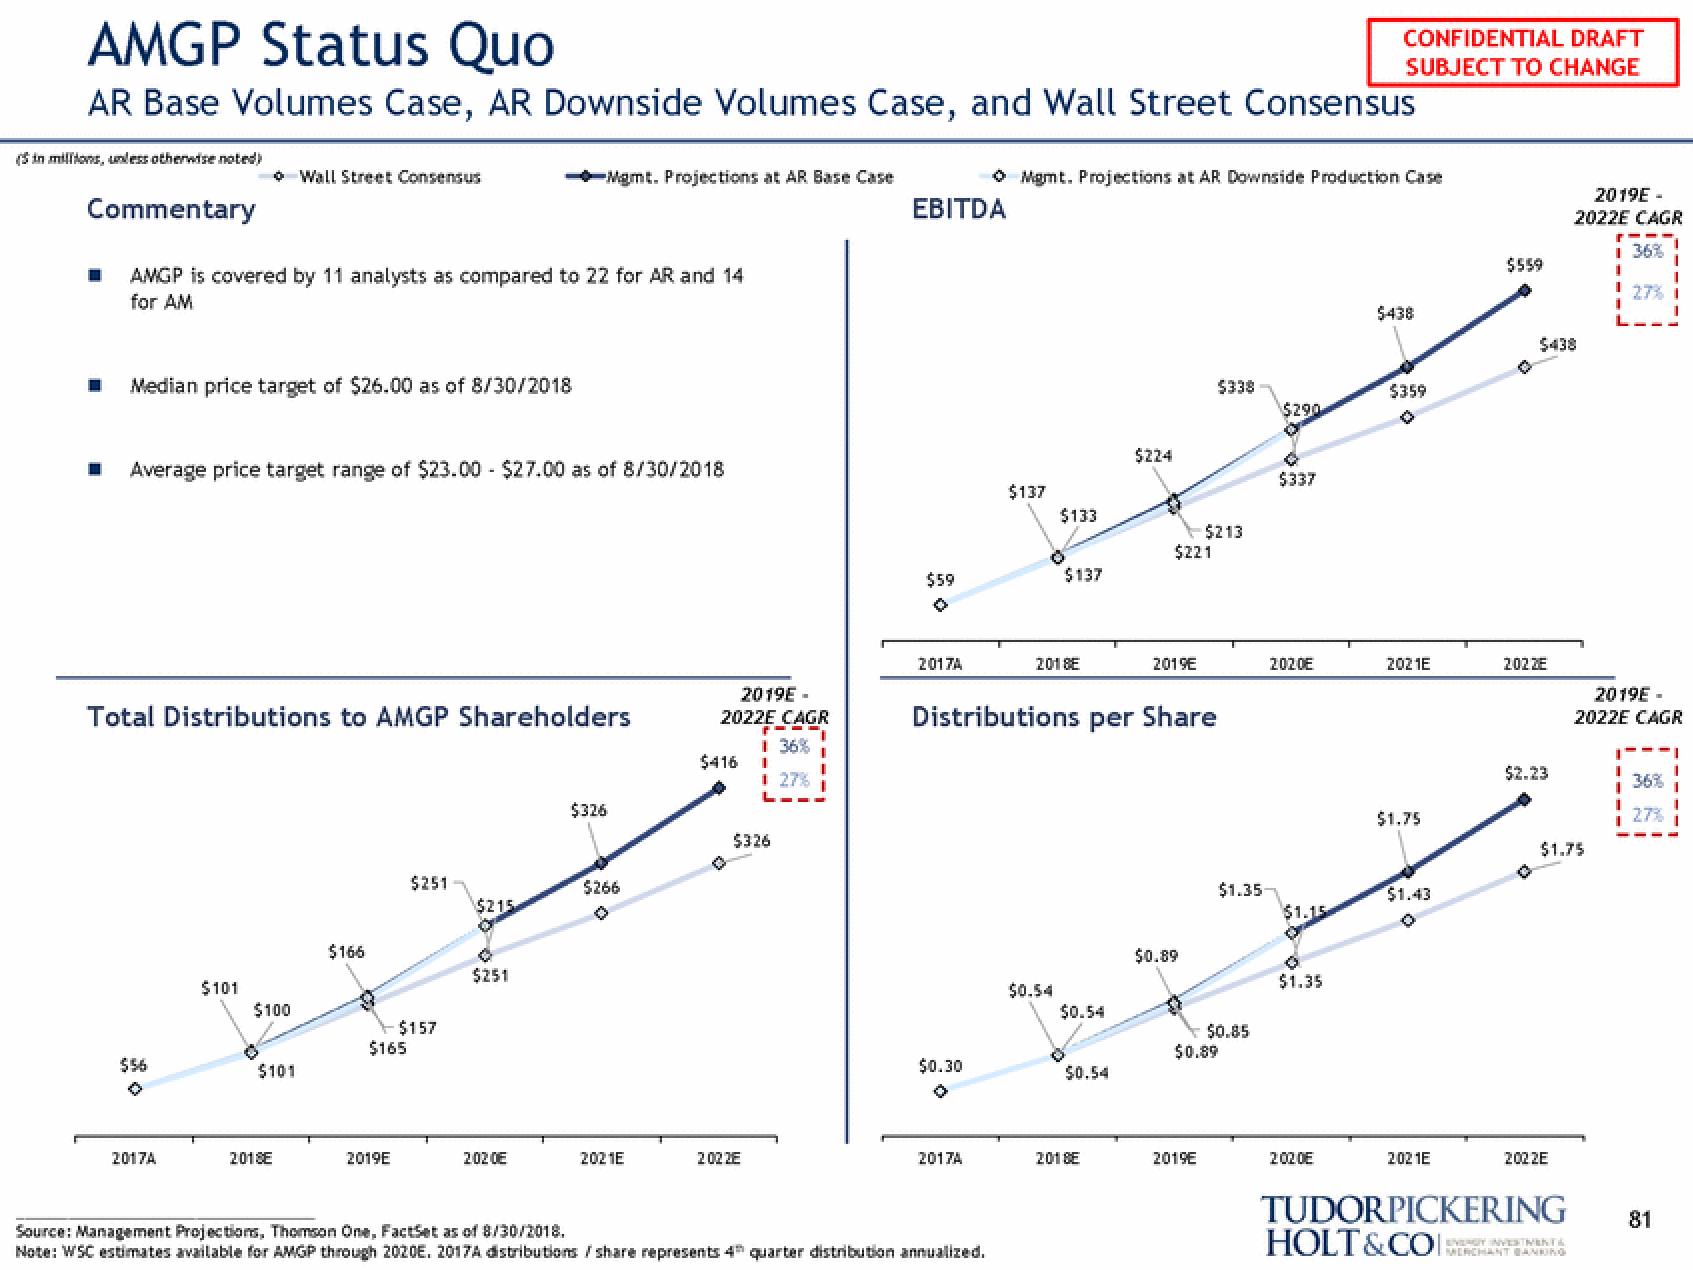
AMGP Status Quo
AR Base Volumes Case, AR Downside Volumes Case, and Wall Street Consensus
(in millions, unless otherwise noted)
Commentary
☐
AMGP is covered by 11 analysts as compared to 22 for AR and 14
for AM
Median price target of $26.00 as of 8/30/2018
Average price target range of $23.00 $27.00 as of 8/30/2018
$56
Total Distributions to AMGP Shareholders
2017A
Wall Street Consensus
$101
$100
$101
2018E
$166
$165
2019E
$251
$157
Mgmt. Projections at AR Base Case
$215
$251
202 CE
$326
$266
2021E
2019E-
2022E CAGR
-
1 36%
$416 I
$326
2022E
EBITDA
$59
2017A
$0.30
O
2017A
ⒸMgmt. Projections at AR Downside Production Case
Source: Management Projections, Thomson One, FactSet as of 8/30/2018.
Note: WSC estimates available for AMGP through 2020E. 2017A distributions / share represents 4 quarter distribution annualized.
$137
$133
$137
2018E
$0.54
Distributions per Share
$0.54
$0.54
$224
2018E
$221
2019E
$0.89
$338
$213
2019E
$0.89
$1.35
$0.85
$290
$337
2020E
$1.15
$1.35
CONFIDENTIAL DRAFT
SUBJECT TO CHANGE
2:02.0E
$438
$359
2021E
$1.75
$1.43
2021E
$559
202 ZE
$438
$2.23
0
2019E-
2022E CAGR
1 36%
1 27% 1
202.2E
$1.75
TUDORPICKERING
HOLT&COCHANT BANKING
2019E-
2022E CAGR
I
27%
81View entire presentation