Toyota Investor Presentation Deck
Performance - Retail Loan
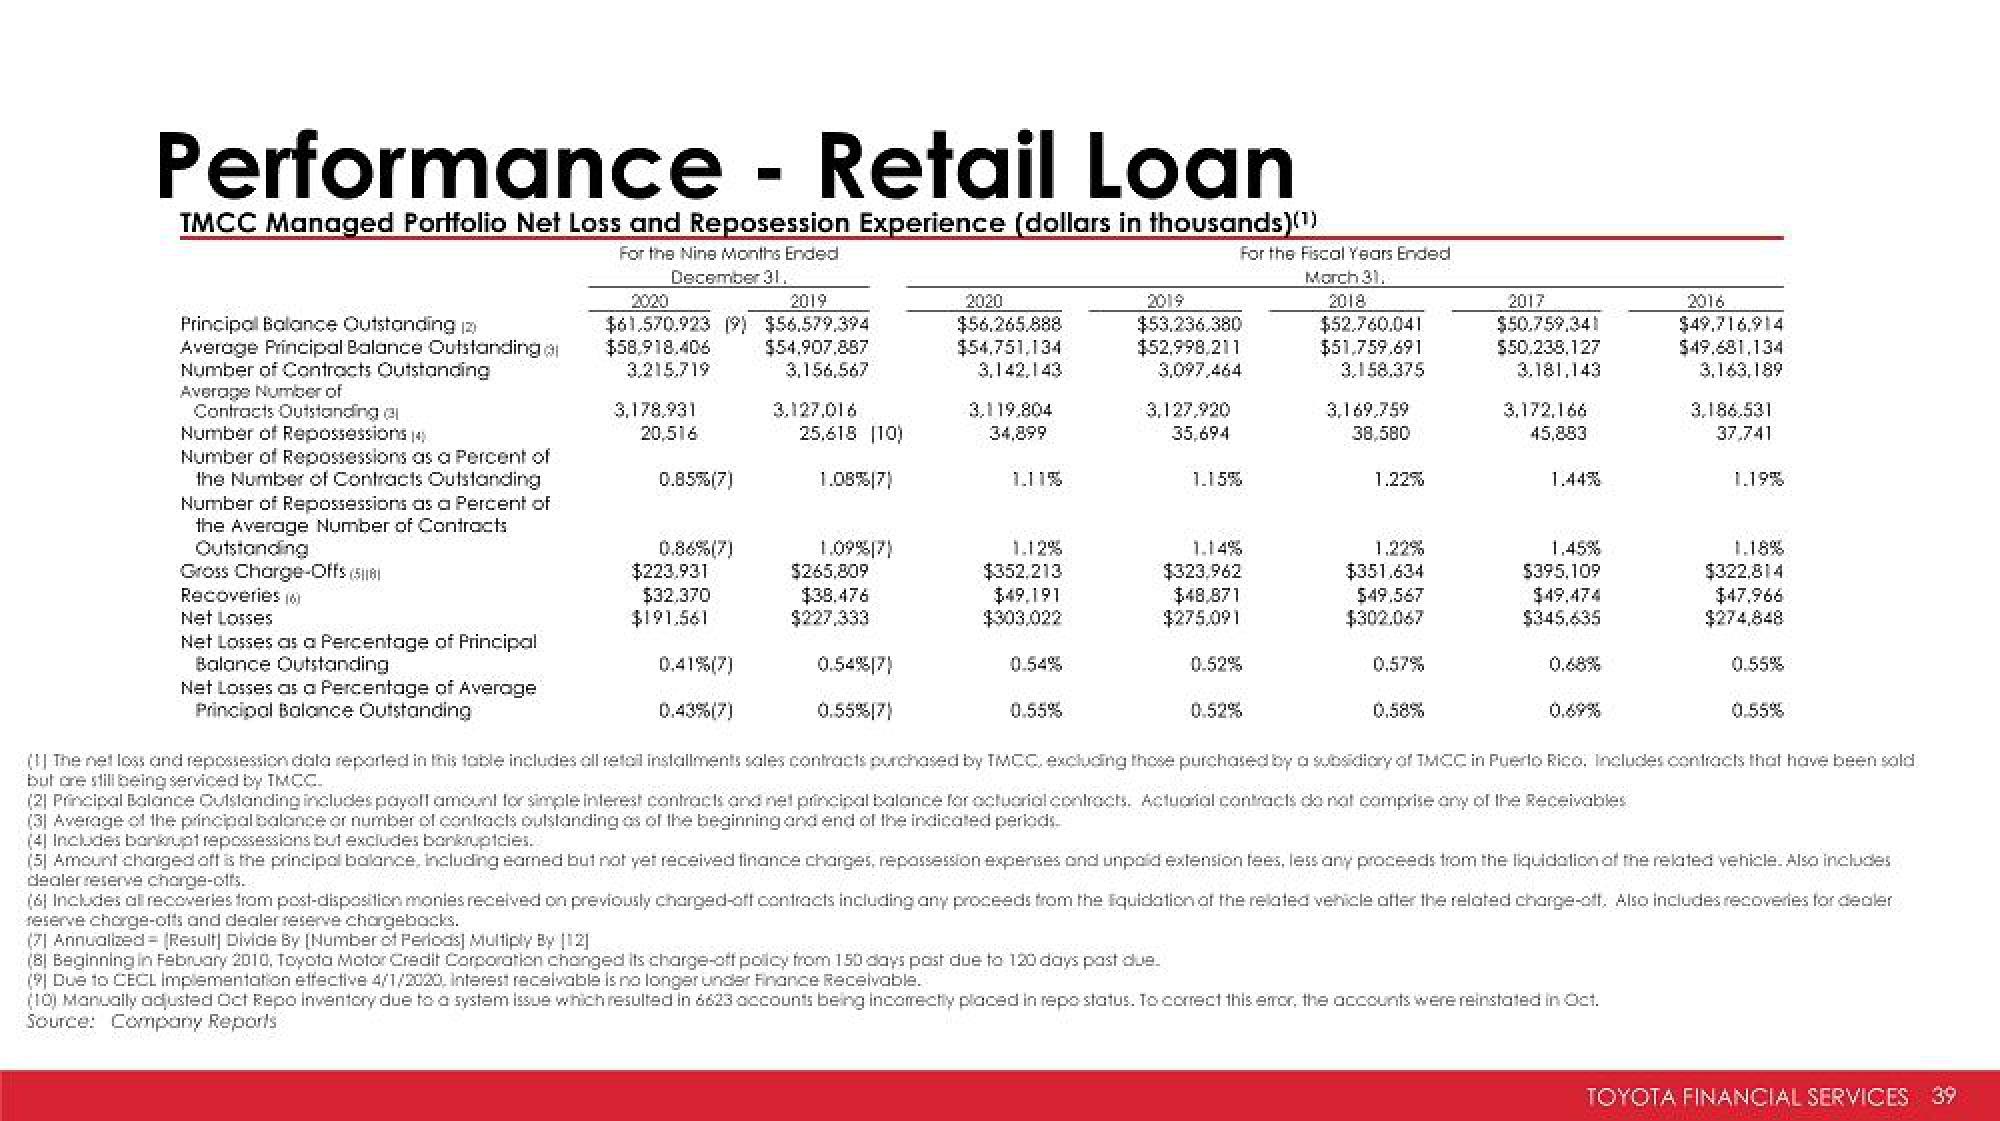
TMCC Managed Portfolio Net Loss and Reposession Experience (dollars in thousands)(¹)
For the Nine Months Ended
December 31.
Principal Balance Outstanding (2)
Average Principal Balance Outstanding a
Number of Contracts Outstanding
Average Number of
Contracts Outstanding (1
Number of Repossessions (4)
Number of Repossessions as a Percent of
the Number of Contracts Outstanding
Number of Repossessions as a Percent of
the Average Number of Contracts
Outstanding
Gross Charge-Offs (581
Recoveries (6)
Net Losses
Net Losses as a Percentage of Principal
Balance Outstanding
2020
2019
$61.570.923 (9) $56.579.394
$58,918.406 $54.907.887
3,156,567
3,215,719
Net Losses as a Percentage of Average
Principal Balance Outstanding
3,178,931
20,516
0.85%(7)
0.86%(7)
$223.931
$32,370
$191.561
3.127,016
25.618 (10)
1.08%(7)
1.09%(7)
$265,809
$38.476
$227,333
0.54%[7)
0.55%(7)
2020
$56.265.888
$54,751,134
3,142,143
3,119.804
34,899
1.11%
1.12%
$352.213
$49.191
$303,022
0.55%
2019
$53.236.380
$52,998,211
3,097,464
3,127,920
35,694
1.15%
For the Fiscal Years Ended
March 31.
2018
$52.760,041
$51,759.691
3,158.375
1.14%
$323,962
$48,871
$275,091
0.52%
3,169,759
38,580
1.22%
1.22%
$351.634
$49.567
$302.067
0.57%
2017
$50.759,341
$50.238.127
3.181,143
0.58%
3,172,166
45,883
1.45%
$395,109
$49.474
$345,635
2016
$49,716,914
$49.681,134
3,163,189
0.41% (7)
0.43%(7)
(1) The net loss and repossession data reported in this table includes all retail installments sales contracts purchased by TMCC, excluding those purchased by a subsidiary of TMCC in Puerto Rico. Includes contracts that have been sold
but are still being serviced by TMCC
(2) Principal Balance Outstanding includes payoll amount for simple interest contracts and net principal balance for actuarial contracts. Actuarial contracts do not comprise any of the Receivables
(3) Average of the principal balance or number of contracts outstanding as of the beginning and end of the indicated periods.
(4) Includes bankrupt repossessions but excludes bankruptcies.
(5) Amount charged off is the principal balance, including eamed but not yet received finance charges, repossession expenses and unpaid extension fees, less any proceeds from the liquidation of the related vehicle. Also includes
dealer reserve charge-offs.
(6) Includes all recoveries from post-disposition monies received on previously charged-off contracts including any proceeds from the liquidation of the related vehicle after the related charge-off. Also includes recoveries for dealer
reserve chorge-offs and dealer reserve chargebacks.
(71 Annualized= [Result] Divide By [Number of Periods] Multiply By [12]
(8) Beginning in February 2010, Toyota Motor Credit Corporation changed its charge-off policy from 150 days past due to 120 days past due.
(9) Due to CECL implementation effective 4/1/2020, Interest receivable is no longer under Finance Receivable.
(10) Manually adjusted Oct Repo inventory due to a system issue which resulted in 6623 accounts being incorrectly placed in repo status. To correct this error, the accounts were reinstated in Oct.
Source: Company Reports
3.186.531
37,741
1.19%
1.18%
$322.814
$47,966
$274,848
0.55%
0.55%
TOYOTA FINANCIAL SERVICES 39View entire presentation