Freyr SPAC Presentation Deck
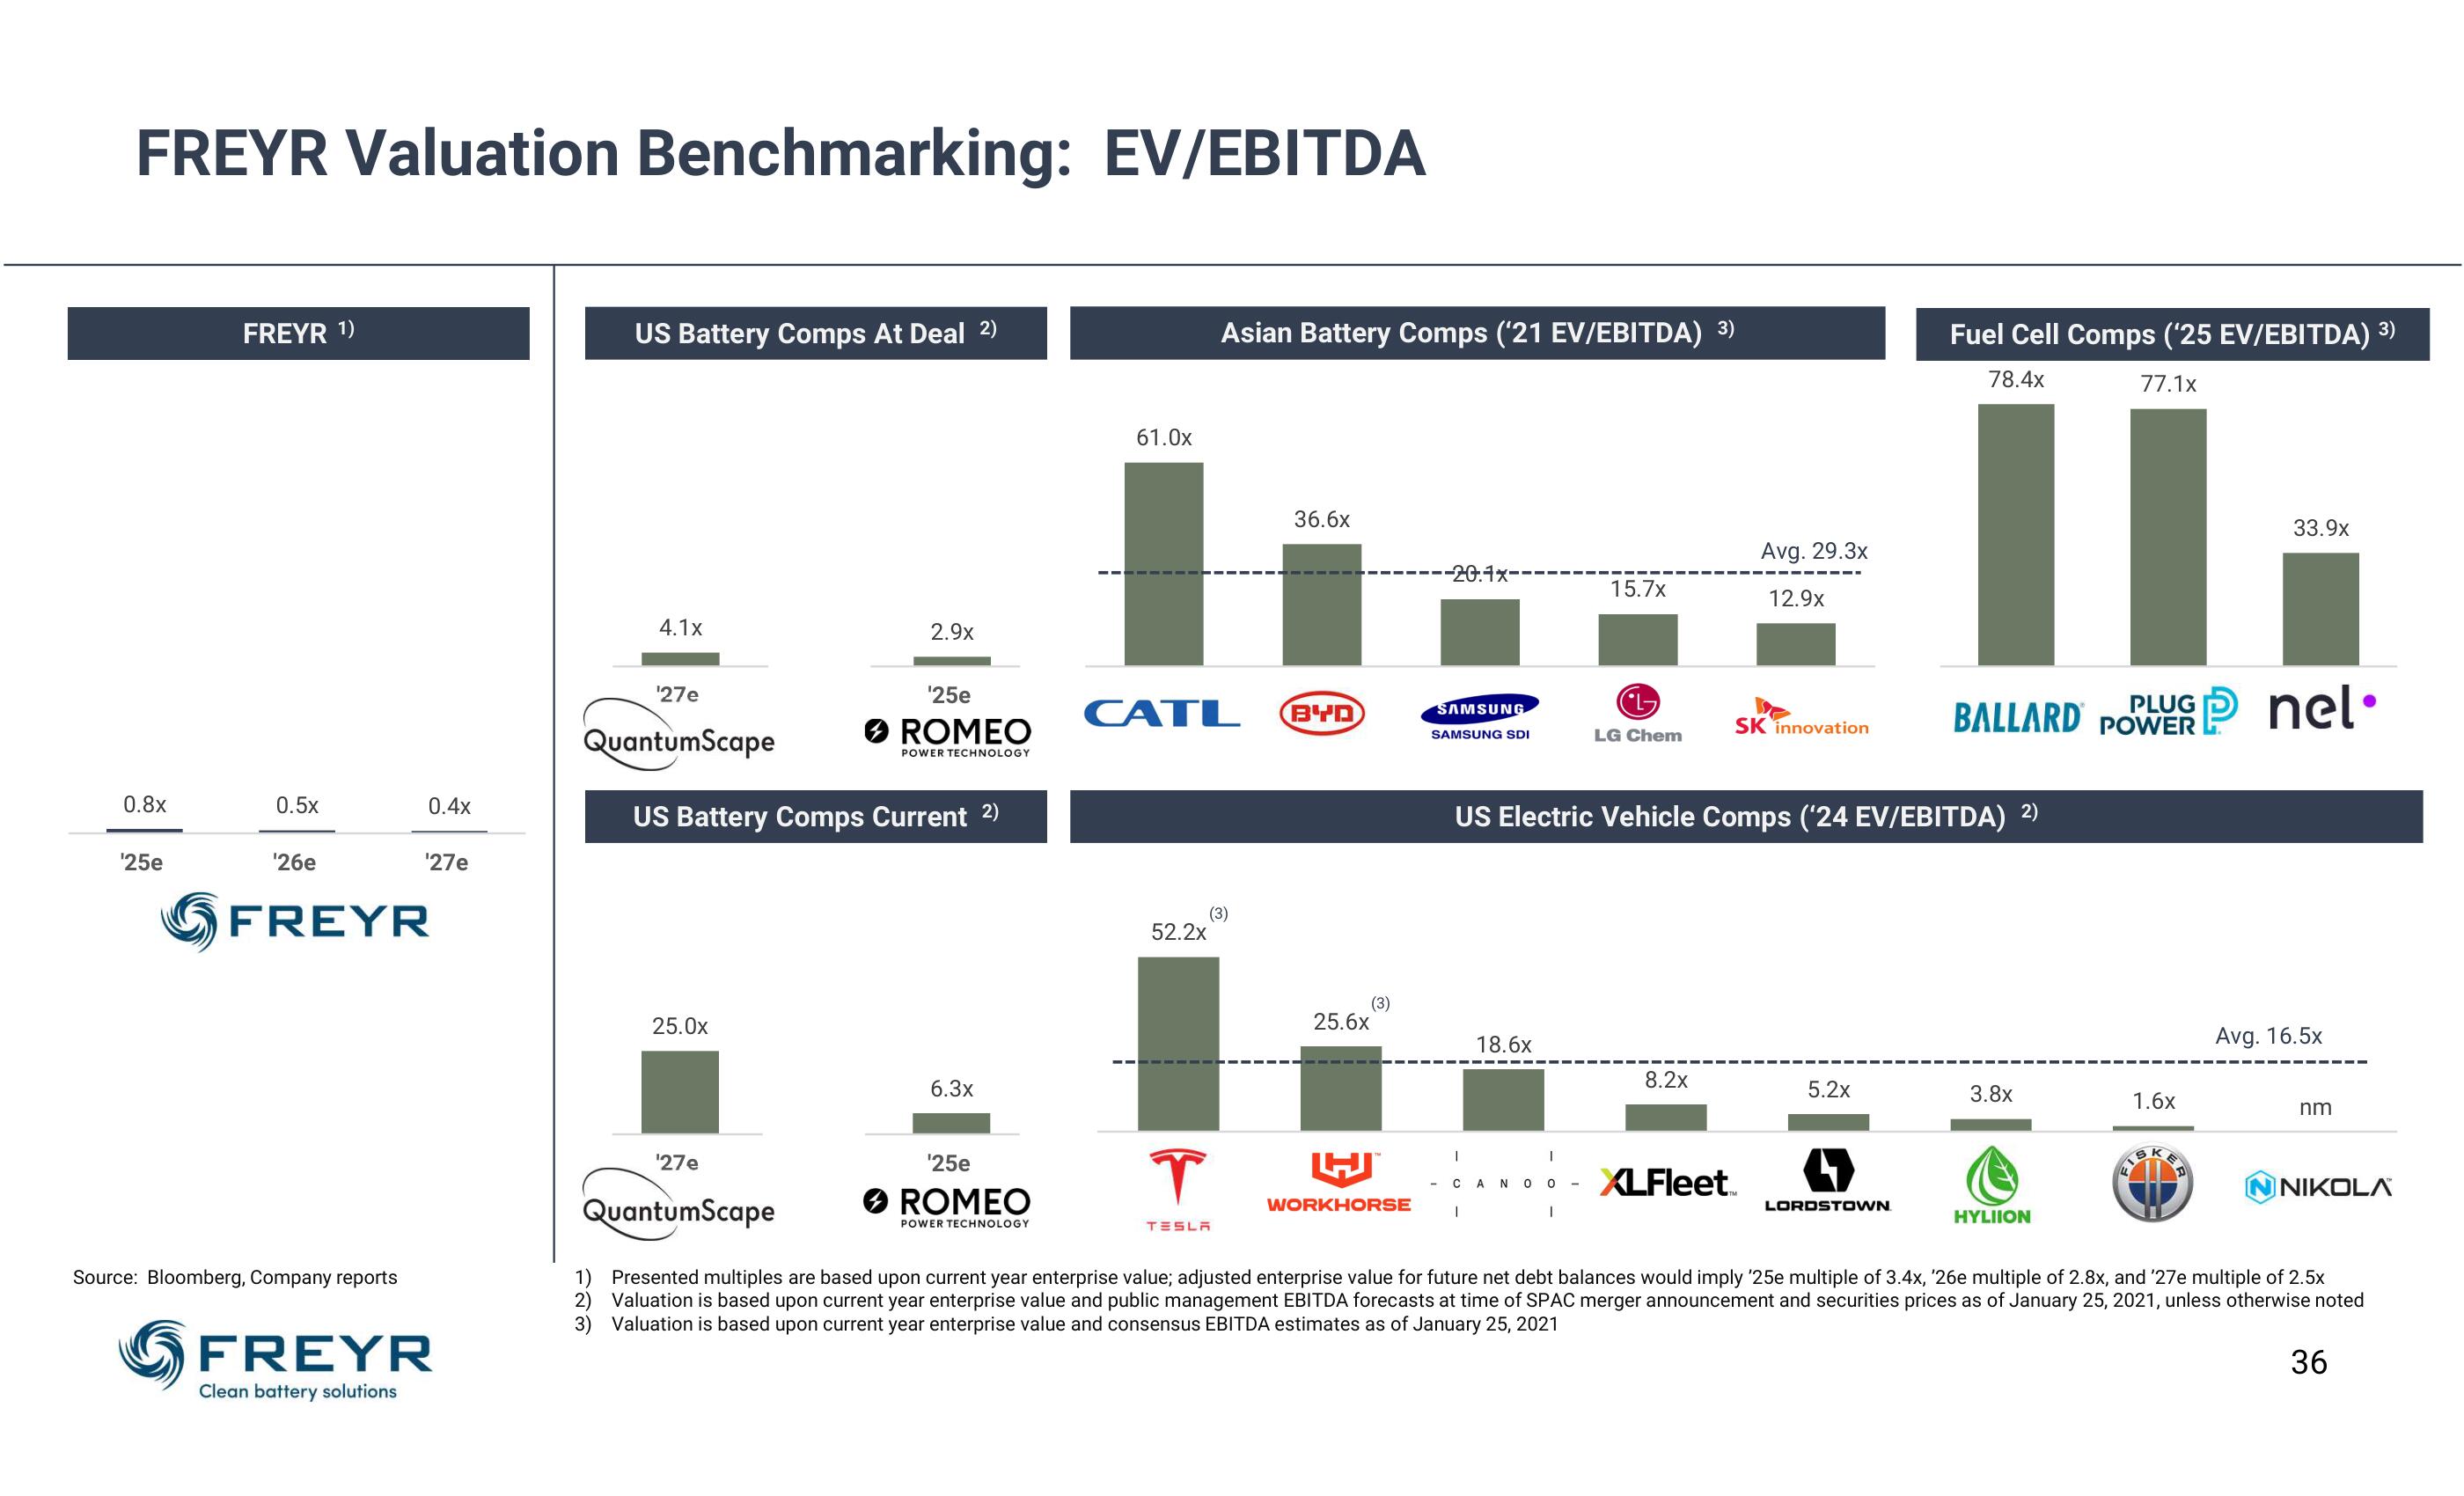
FREYR Valuation Benchmarking: EV/EBITDA
0.8x
'25e
FREYR ¹)
0.5x
'26e
FREYR
Source: Bloomberg, Company reports
0.4x
¹27e
FREYR
Clean battery solutions
US Battery Comps At Deal 2)
4.1x
¹27e
QuantumScape
25.0x
2.9x
US Battery Comps Current 2)
¹27e
QuantumScape
¹25e
ROMEO
POWER TECHNOLOGY
6.3x
¹25e
ROMEO
POWER TECHNOLOGY
61.0x
CATL
52.2x
T
Asian Battery Comps ('21 EV/EBITDA) 3)
(3)
TESLA
36.6x
BYD
(3)
25.6x
WORKHORSE
-20.1x-
SAMSUNG
SAMSUNG SDI
18.6x
-CANOO
1
15.7x
I
L
LG Chem
US Electric Vehicle Comps ('24 EV/EBITDA) 2)
8.2x
Avg. 29.3x
12.9x
XLFleet
SK innovation
5.2x
Fuel Cell Comps ('25 EV/EBITDA) 3)
78.4x
77.1x
LORDSTOWN
PLUG
BALLARD POWER
3.8x
HYLIION
1.6x
FIBRER
33.9x
nel.
Avg. 16.5x
nm
NIKOLA
1) Presented multiples are based upon current year enterprise value; adjusted enterprise value for future net debt balances would imply '25e multiple of 3.4x, '26e multiple of 2.8x, and '27e multiple of 2.5x
2) Valuation is based upon current year enterprise value and public management EBITDA forecasts at time of SPAC merger announcement and securities prices as of January 25, 2021, unless otherwise noted
Valuation is based upon current year enterprise value and consensus EBITDA estimates as of January 25, 2021
3)
36View entire presentation