One Medical Investor Conference Presentation Deck
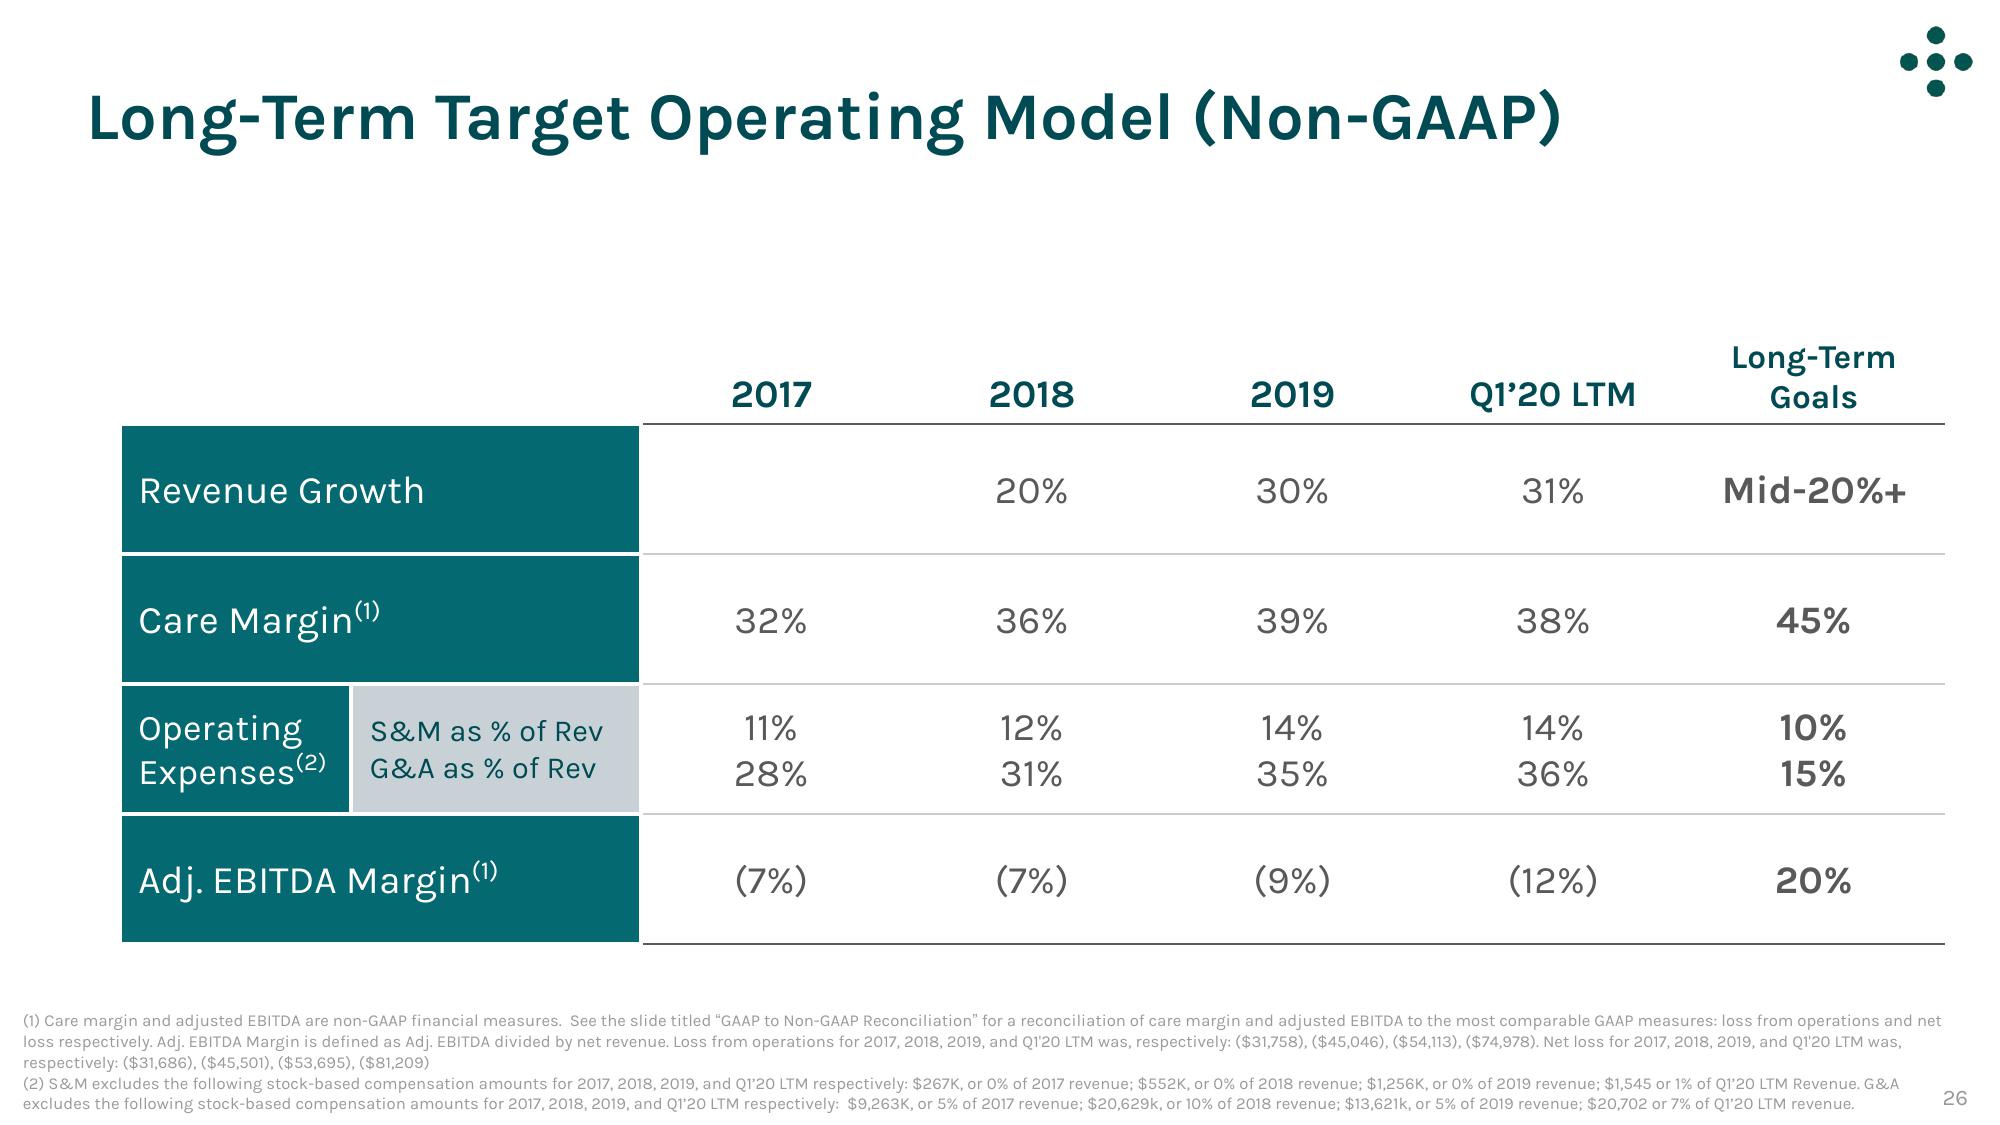
Long-Term Target Operating Model (Non-GAAP)
Revenue Growth
Care Margin(¹)
Operating
Expenses (2)
S&M as % of Rev
G&A as % of Rev
Adj. EBITDA Margin(¹)
2017
32%
11%
28%
(7%)
2018
20%
36%
12%
31%
(7%)
2019
30%
39%
14%
35%
(9%)
Q1'20 LTM
31%
38%
14%
36%
(12%)
Long-Term
Goals
Mid-20%+
45%
10%
15%
20%
(1) Care margin and adjusted EBITDA are non-GAAP financial measures. See the slide titled "GAAP to Non-GAAP Reconciliation" for a reconciliation of care margin and adjusted EBITDA to the most comparable GAAP measures: loss from operations and net
loss respectively. Adj. EBITDA Margin is defined as Adj. EBITDA divided by net revenue. Loss from operations for 2017, 2018, 2019, and Q1'20 LTM was, respectively: ($31,758), ($45,046), ($54,113), ($74,978). Net loss for 2017, 2018, 2019, and Q1'20 LTM was,
respectively: ($31,686), ($45,501), ($53,695), ($81,209)
(2) S&M excludes the following stock-based compensation amounts for 2017, 2018, 2019, and Q1'20 LTM respectively: $267K, or 0% of 2017 revenue; $552K, or 0% of 2018 revenue; $1,256K, or 0% of 2019 revenue; $1,545 or 1% of Q1'20 LTM Revenue. G&A
excludes the following stock-based compensation amounts for 2017, 2018, 2019, and Q1'20 LTM respectively: $9,263K, or 5% of 2017 revenue; $20,629k, or 10% of 2018 revenue: $13,621k, or 5% of 2019 revenue; $20,702 or 7% of Q1'20 LTM revenue.
26View entire presentation