Uber Results Presentation Deck
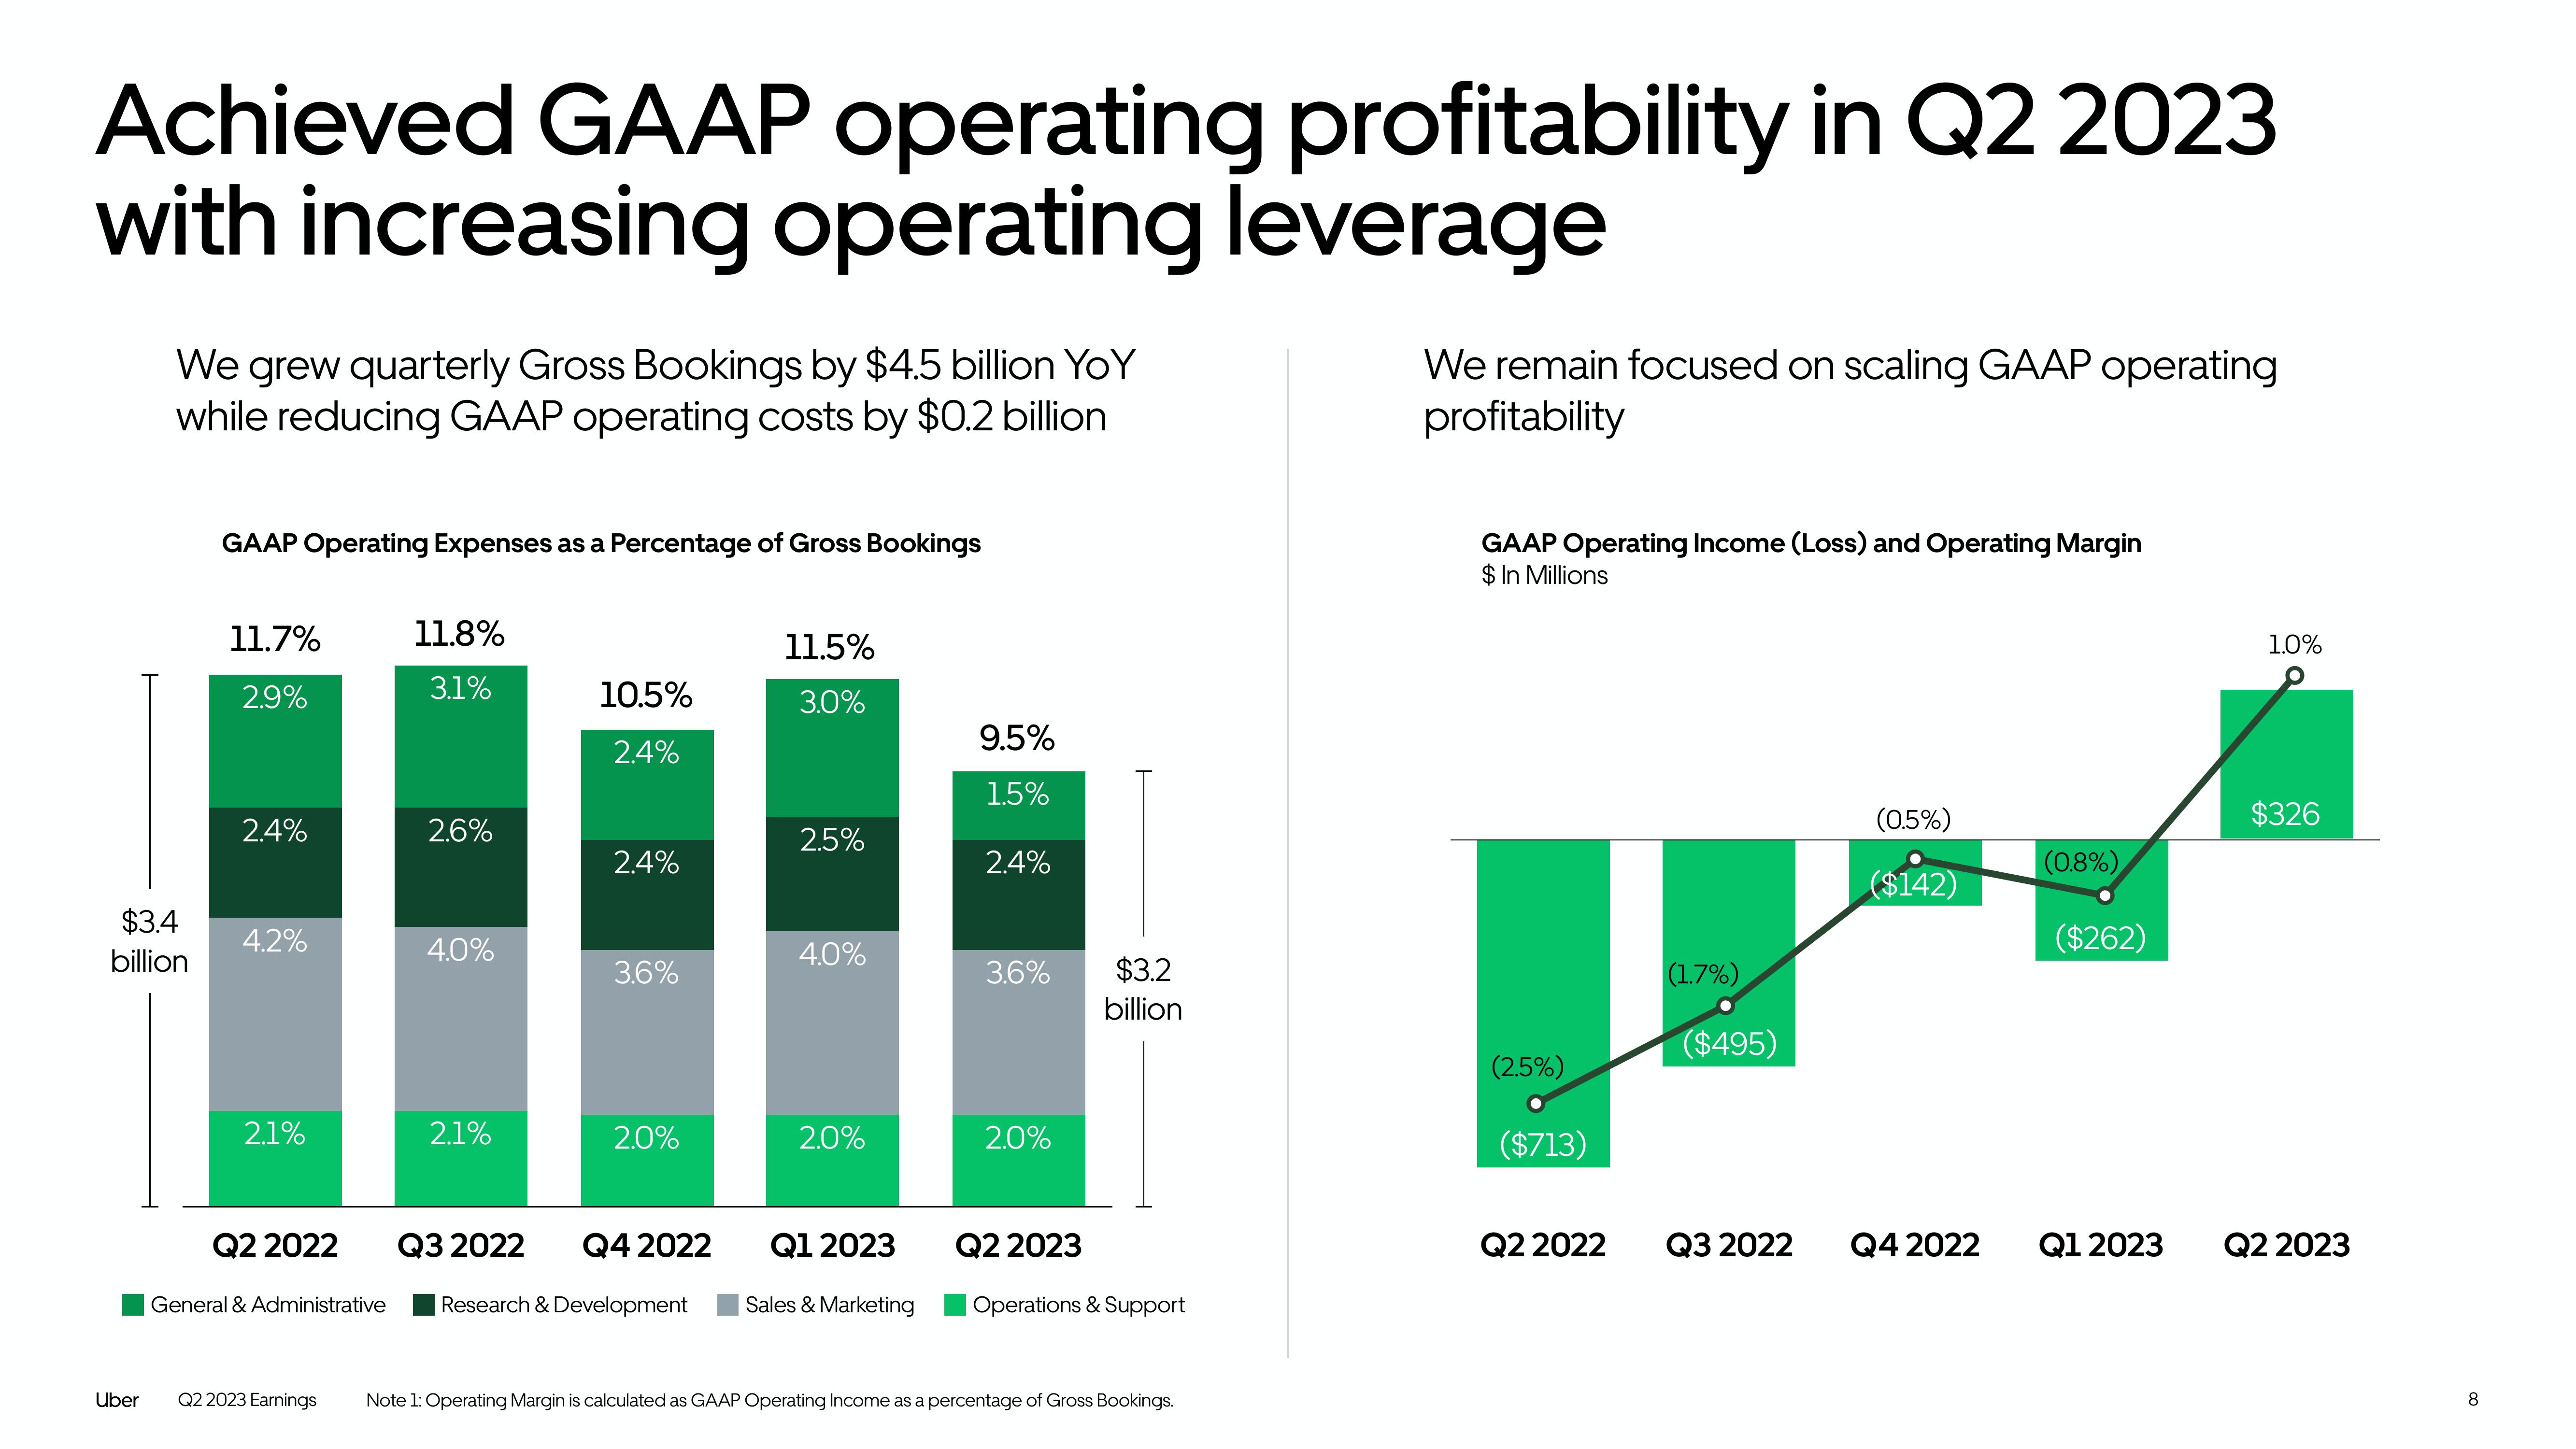
Achieved GAAP operating profitability in Q2 2023
with increasing operating leverage
We grew quarterly Gross Bookings by $4.5 billion YoY
while reducing GAAP operating costs by $0.2 billion
$3.4
billion
Uber
GAAP Operating Expenses as a Percentage of Gross Bookings
11.7%
2.9%
2.4%
4.2%
2.1%
Q2 2022
General & Administrative
Q2 2023 Earnings
11.8%
3.1%
2.6%
4.0%
2.1%
Q3 2022
10.5%
2.4%
2.4%
3.6%
2.0%
Q4 2022
Research & Development
11.5%
3.0%
2.5%
4.0%
2.0%
Q1 2023
Sales & Marketing
9.5%
1.5%
2.4%
3.6%
2.0%
Q2 2023
$3.2
billion
Operations & Support
Note 1: Operating Margin is calculated as GAAP Operating Income as a percentage of Gross Bookings.
We remain focused on scaling GAAP operating
profitability
GAAP Operating Income (Loss) and Operating Margin
$ In Millions
(2.5%)
($713)
Q2 2022
(1.7%)
($495)
Q3 2022
(0.5%)
($142)
Q4 2022
(0.8%)
($262)
Q1 2023
1.0%
$326
Q2 2023
8View entire presentation