Nexters SPAC Presentation Deck
Key financial highlights (1/2)
$m
Revenue
65
Q3 2020
$m
Net Income/ Loss
-11
Q3 2020
+77%
115
Q3 2021
-104
Q3 2021
$m
Operating Cash Flow
$m
32
Q3 2020
+59%
Adjusted Net Income/ Loss (1)
-11
Q3 2020
Q3 2021
8
Q3 2021
Source: Company information
211) The Company defines Adjusted Net Income/Loss as the Net Income/Loss as presented in the Company's financial statements in accordance with IFRS, adjusted to exclude (i) share-based compensation expense, (ii)
impairment of non-current assets, (iii) any gains and losses arising as result of business combinations (including the amortisation of intangible assets acquired in the business combinations and transaction costs related to
the business combinations) and (iv) certain non-cash or other special items that we do not consider indicative of our ongoing operating performance. Adjusted net income is a non-IFRS financial measure and should not be
construed as an alternative to Net Income/ Loss as an indicator of operating performance as determined in accordance with IFRS
nexters
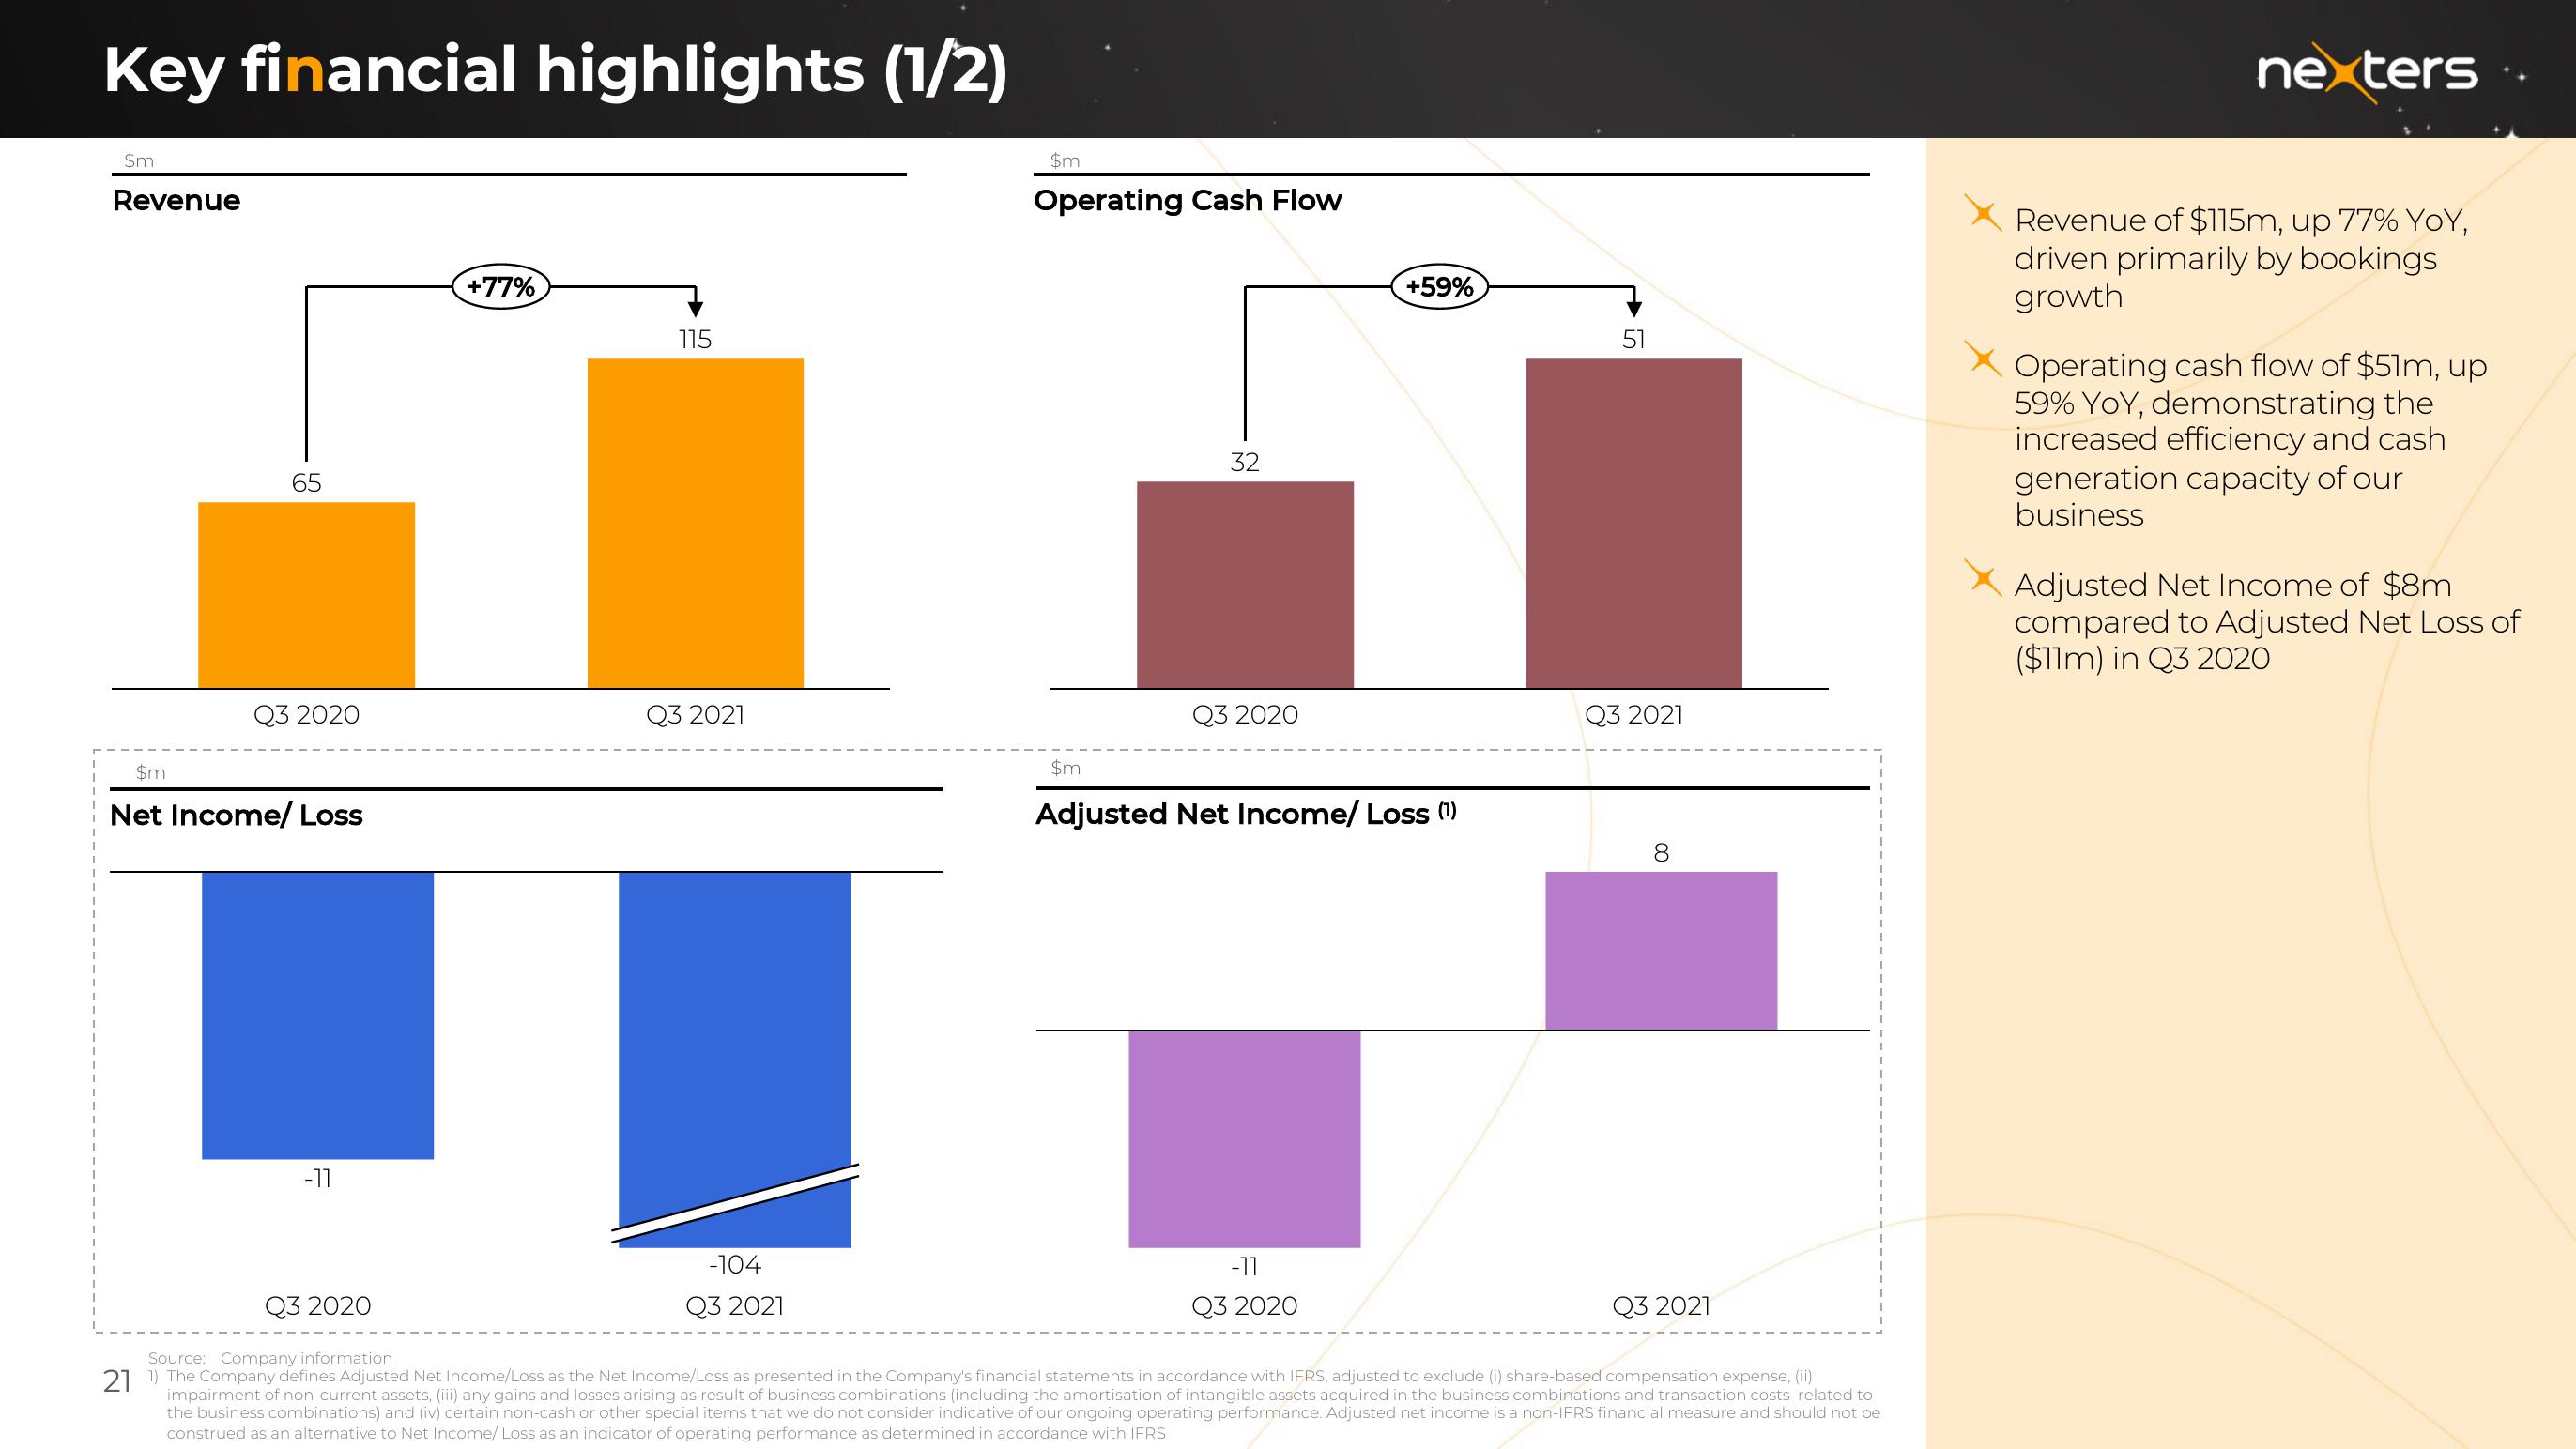
Revenue of $115m, up 77% YOY,
driven primarily by bookings
growth
X Operating cash flow of $51m, up
59% YOY, demonstrating the
increased efficiency and cash
generation capacity of our
business
Adjusted Net Income of $8m
compared to Adjusted Net Loss of
($11m) in Q3 2020View entire presentation