Massachusetts Water Resources Authority (“MWRA”) Employees’ Retirement System
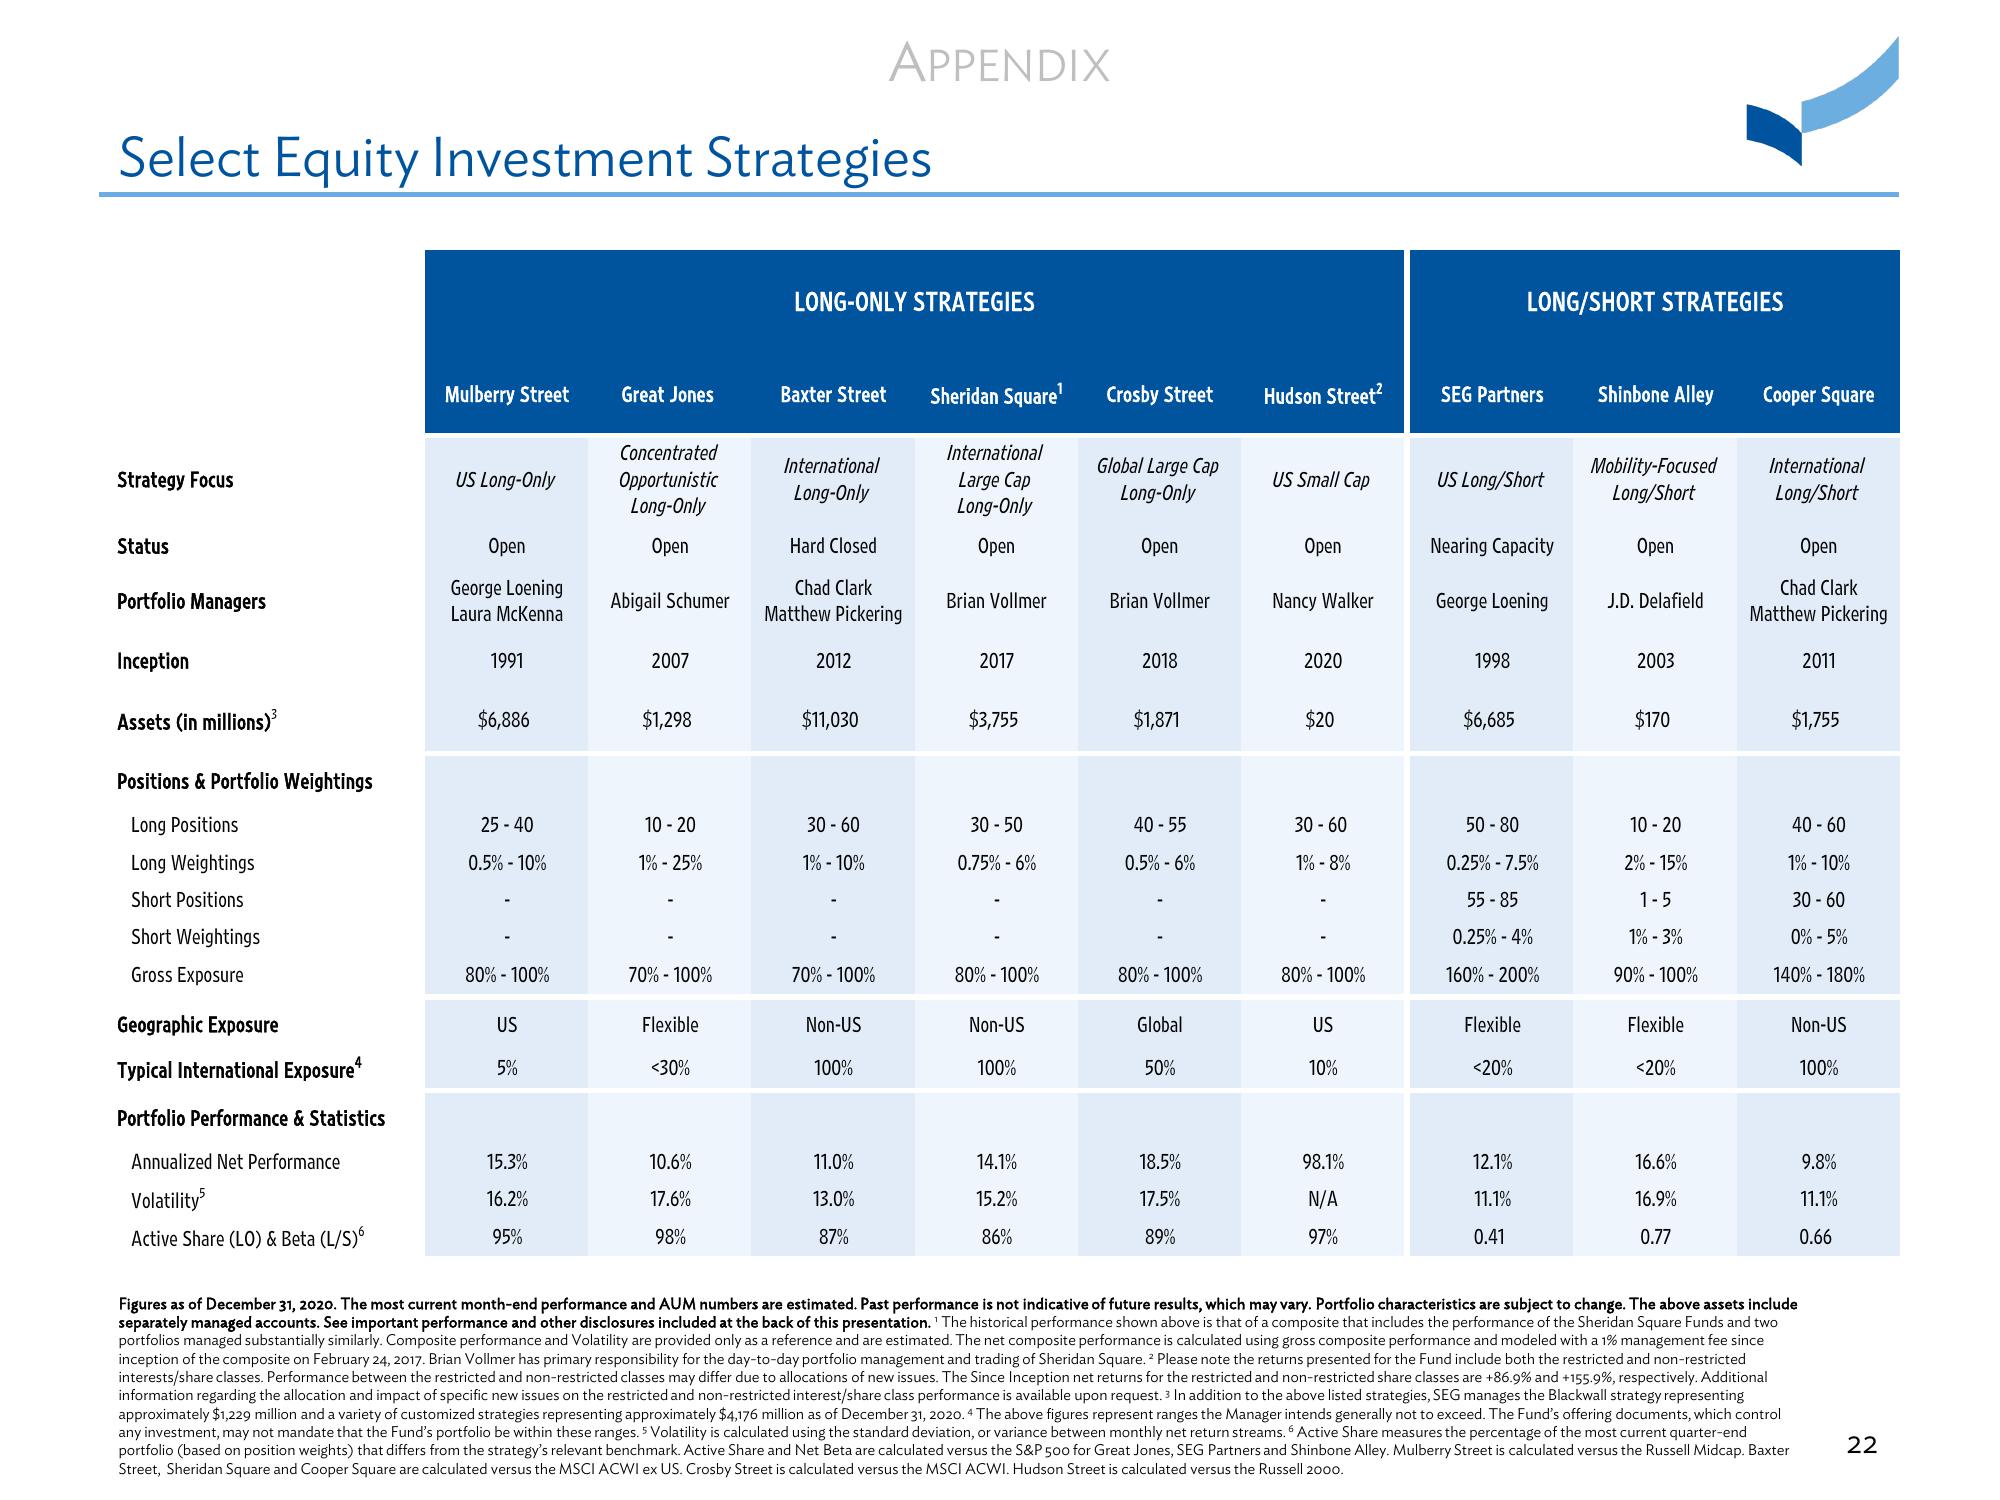
Select Equity Investment Strategies
Strategy Focus
Status
Portfolio Managers
Inception
Assets (in millions)³
Positions & Portfolio Weightings
Long Positions
Long Weightings
Short Positions
Short Weightings
Gross Exposure
Geographic Exposure
Typical International Exposure+
Portfolio Performance & Statistics
Annualized Net Performance
Volatility5
Active Share (LO) & Beta (L/S)6
Mulberry Street
US Long-Only
Open
George Loening
Laura McKenna
1991
$6,886
25-40
0.5% -10%
80%-100%
US
5%
15.3%
16.2%
95%
Great Jones
Concentrated
Opportunistic
Long-Only
Open
Abigail Schumer
2007
$1,298
10-20
1% - 25%
70% - 100%
Flexible
<30%
10.6%
17.6%
98%
LONG-ONLY STRATEGIES
Baxter Street
International
Long-Only
Hard Closed
Chad Clark
Matthew Pickering
2012
$11,030
30-60
1% - 10%
APPENDIX
70% - 100%
Non-US
100%
11.0%
13.0%
87%
Sheridan Square'
International
Large Cap
Long-Only
Open
Brian Vollmer
2017
$3,755
30-50
0.75% -6%
80% - 100%
Non-US
100%
14.1%
15.2%
86%
Crosby Street
Global Large Cap
Long-Only
Open
Brian Vollmer
2018
$1,871
40-55
0.5% -6%
80% - 100%
Global
50%
18.5%
17.5%
89%
Hudson Street²
US Small Cap
Open
Nancy Walker
2020
$20
30-60
1% -8%
80% - 100%
US
10%
98.1%
N/A
97%
SEG Partners
US Long/Short
Nearing Capacity
George Loening
1998
LONG/SHORT STRATEGIES
$6,685
50-80
0.25% -7.5%
55-85
0.25% -4%
160% - 200%
Flexible
<20%
12.1%
11.1%
0.41
Shinbone Alley
Mobility-Focused
Long/Short
Open
J.D. Delafield
2003
$170
10 - 20
2% -15%
1-5
1% -3%
90%-100%
Flexible
<20%
16.6%
16.9%
0.77
Cooper Square
International
Long/Short
Open
Chad Clark
Matthew Pickering
2011
$1,755
40-60
1% - 10%
30-60
0% - 5%
140% - 180%
Non-US
Figures as of December 31, 2020. The most current month-end performance and AUM numbers are estimated. Past performance is not indicative of future results, which may vary. Portfolio characteristics are subject to change. The above assets include
separately managed accounts. See important performance and other disclosures included at the back of this presentation. The historical performance shown above is that of a composite that includes the performance of the Sheridan Square Funds and two
portfolios managed substantially similarly. Composite performance and Volatility are provided only as a reference and are estimated. The net composite performance is calculated using gross composite performance and modeled with a 1% management fee since
inception of the composite on February 24, 2017. Brian Vollmer has primary responsibility for the day-to-day portfolio management and trading of Sheridan Square. ² Please note the returns presented for the Fund include both the restricted and non-restricted
interests/share classes. Performance between the restricted and non-restricted classes may differ due to allocations of new issues. The Since Inception net returns for the restricted and non-restricted share classes are +86.9% and +155.9%, respectively. Additional
information regarding the allocation and impact of specific new issues on the restricted and non-restricted interest/share class performance is available upon request. 3 In addition to the above listed strategies, SEG manages the Blackwall strategy representing
approximately $1,229 million and a variety of customized strategies representing approximately $4,176 million as of December 31, 2020.4 The above figures represent ranges the Manager intends generally not to exceed. The Fund's offering documents, which control
any investment, may not mandate that the Fund's portfolio be within these ranges. 5 Volatility is calculated using the standard deviation, or variance between monthly net return streams. Active Share measures the percentage of the most current quarter-end
portfolio (based on position weights) that differs from the strategy's relevant benchmark. Active Share and Net Beta are calculated versus the S&P 500 for Great Jones, SEG Partners and Shinbone Alley. Mulberry Street is calculated versus the Russell Midcap. Baxter
Street, Sheridan Square and Cooper Square are calculated versus the MSCI ACWI ex US. Crosby Street is calculated versus the MSCI ACWI. Hudson Street is calculated versus the Russell 2000.
100%
9.8%
11.1%
0.66
22View entire presentation