Cloudera Investor Presentation Deck
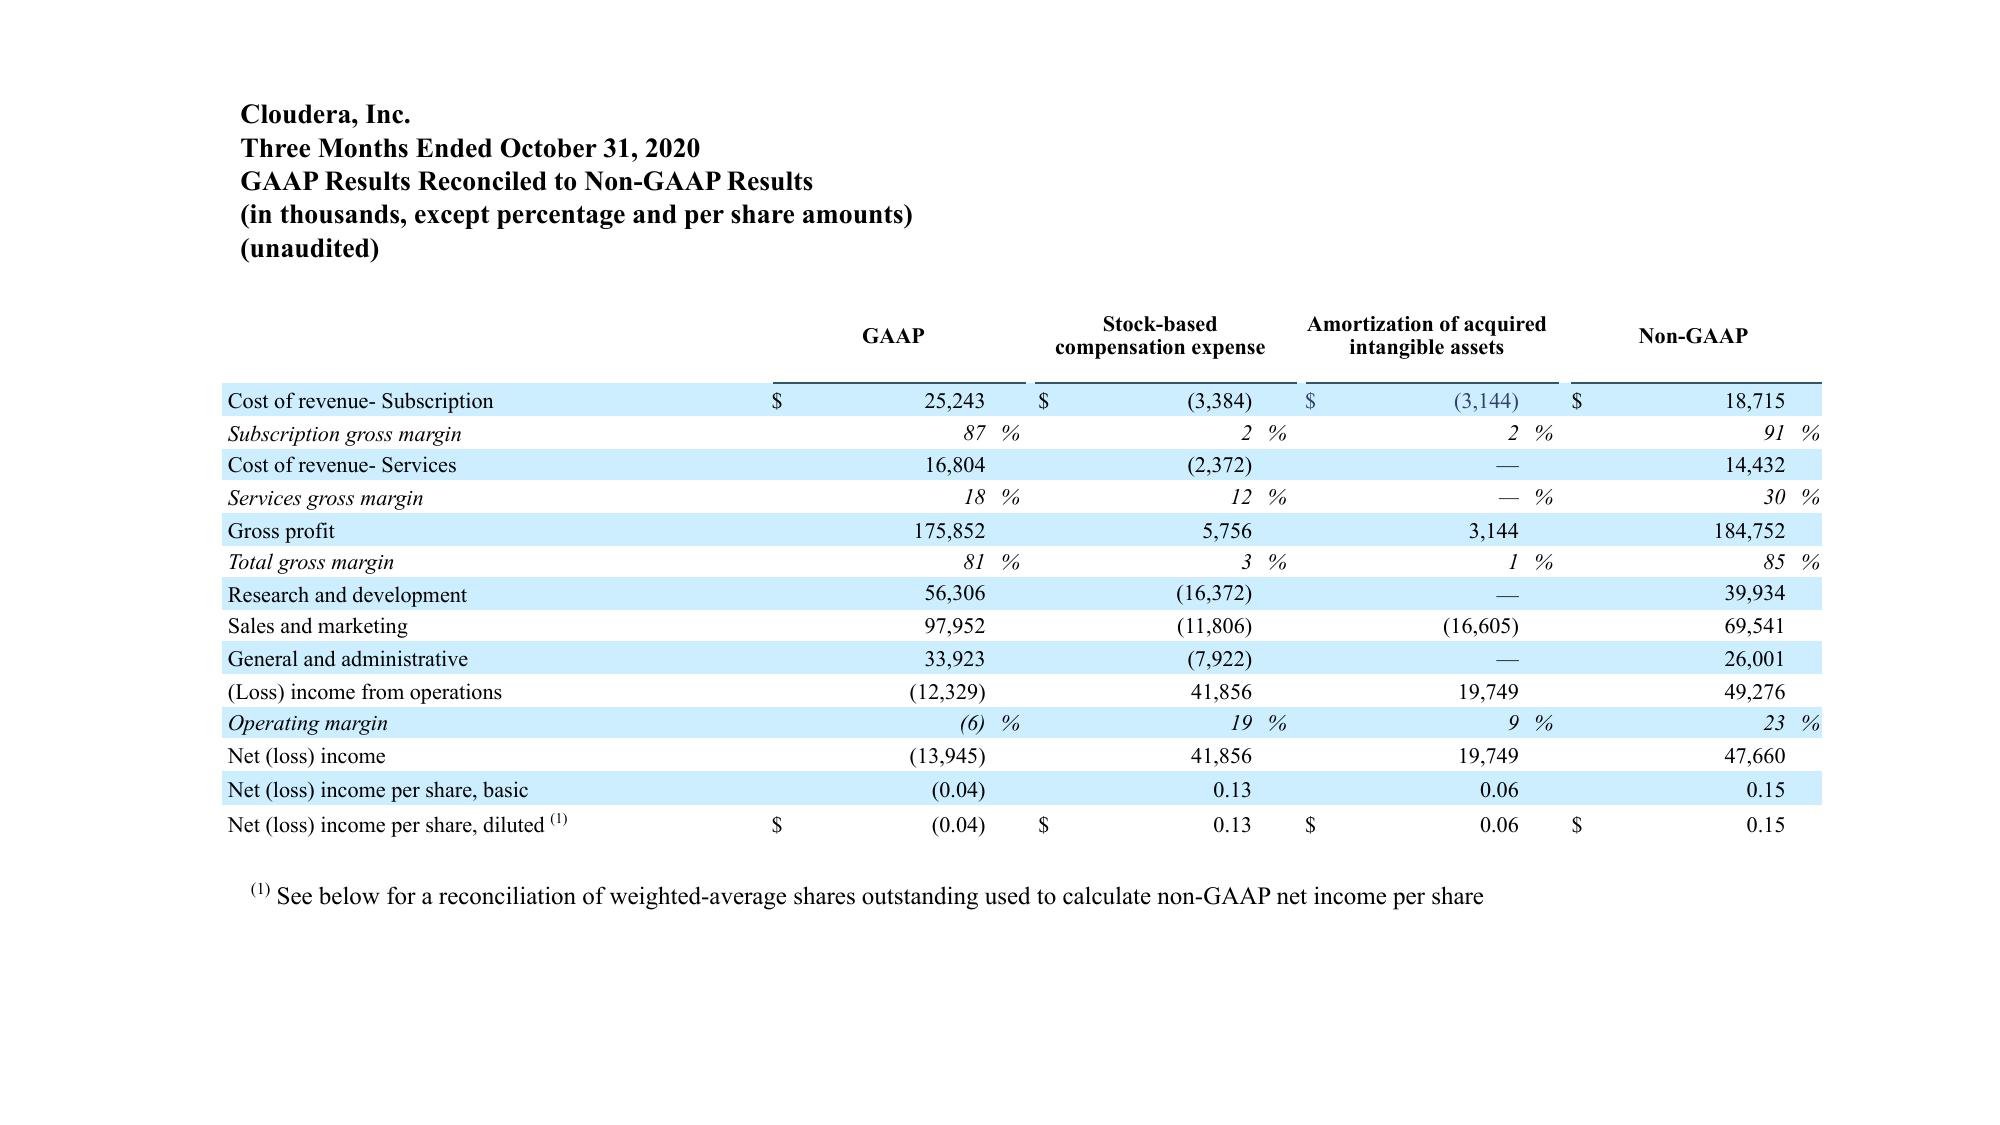
Cloudera, Inc.
Three Months Ended October 31, 2020
GAAP Results Reconciled to Non-GAAP Results
(in thousands, except percentage and per share amounts)
(unaudited)
Cost of revenue- Subscription
Subscription gross margin
Cost of revenue- Services
Services gross margin
Gross profit
Total gross margin
Research and development
Sales and marketing
General and administrative
(Loss) income from operations
Operating margin
Net (loss) income
Net (loss) income per share, basic
Net (loss) income per share, diluted (¹)
$
$
GAAP
25,243
87 %
16,804
18 %
175,852
81 %
56,306
97,952
33,923
(12,329)
(6) %
(13,945)
(0.04)
(0.04)
$
$
Stock-based
compensation expense
(3,384)
2%
(2,372)
12 %
5,756
3%
(16,372)
(11,806)
(7,922)
41,856
19 %
41,856
0.13
0.13
Amortization of acquired
intangible assets
$
$
(3,144) $
2%
3,144
(16,605)
1%
19,749
(¹) See below for a reconciliation of weighted-average shares outstanding used to calculate non-GAAP net income per share
%
19,749
0.06
0.06
9%
$
Non-GAAP
18,715
91%
14,432
30 %
184,752
85 %
39,934
69,541
26,001
49,276
23 %
47,660
0.15
0.15View entire presentation