Jefferies Financial Group Investor Day Presentation Deck
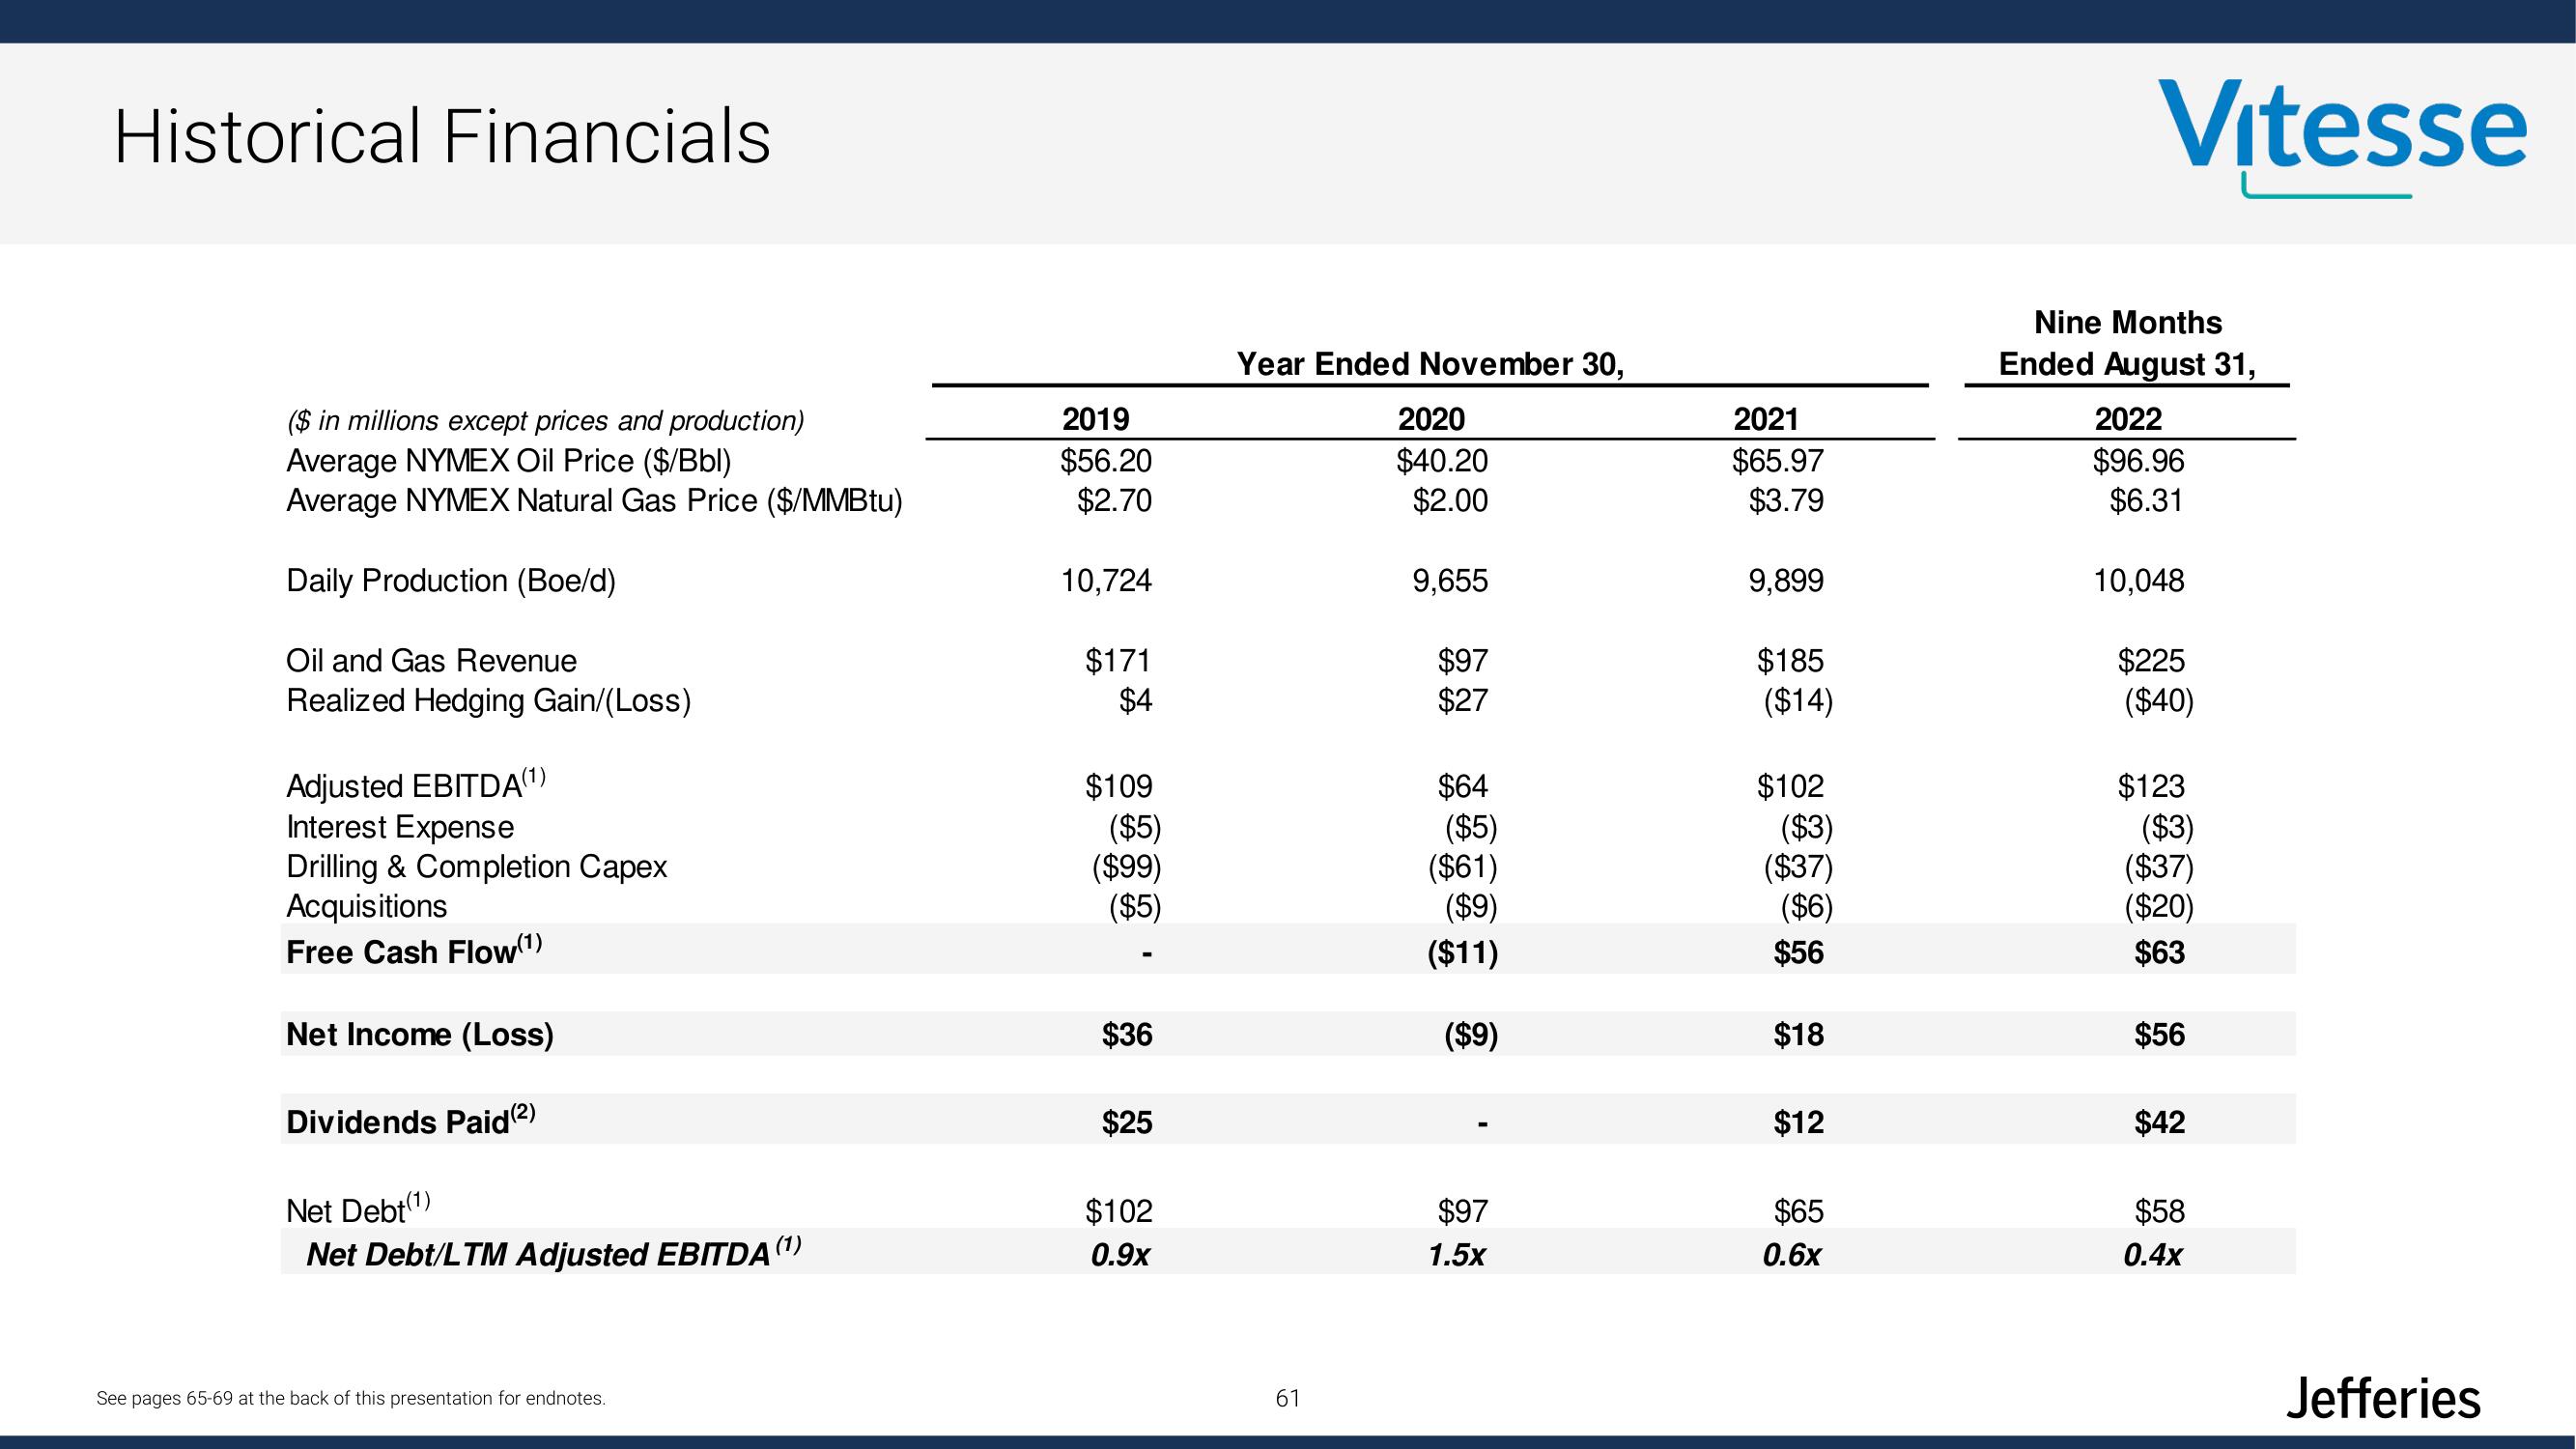
Historical Financials
($ in millions except prices and production)
Average NYMEX Oil Price ($/Bbl)
Average NYMEX Natural Gas Price ($/MMBtu)
Daily Production (Boe/d)
Oil and Gas Revenue
Realized Hedging Gain/(Loss)
Adjusted EBITDA(1)
Interest Expense
Drilling & Completion Capex
Acquisitions
Free Cash Flow(1)
Net Income (Loss)
Dividends Paid (²)
Net Debt(¹)
Net Debt/LTM Adjusted EBITDA
See pages 65-69 at the back of this presentation for endnotes.
(1)
2019
$56.20
$2.70
10,724
$171
$4
$109
($5)
($99)
($5)
$36
$25
$102
0.9x
Year Ended November 30,
61
2020
$40.20
$2.00
9,655
$97
$27
$64
($5)
($61)
($9)
($11)
($9)
$97
1.5x
2021
$65.97
$3.79
9,899
$185
($14)
$102
($3)
($37)
($6)
$56
$18
$12
$65
0.6x
Vitesse
Nine Months
Ended August 31,
2022
$96.96
$6.31
10,048
$225
($40)
$123
($3)
($37)
($20)
$63
$56
$42
$58
0.4x
JefferiesView entire presentation